Login
Join with us
Forgot Password
Password Reset
If you have not received the OTP, please check your spam or junk folder.
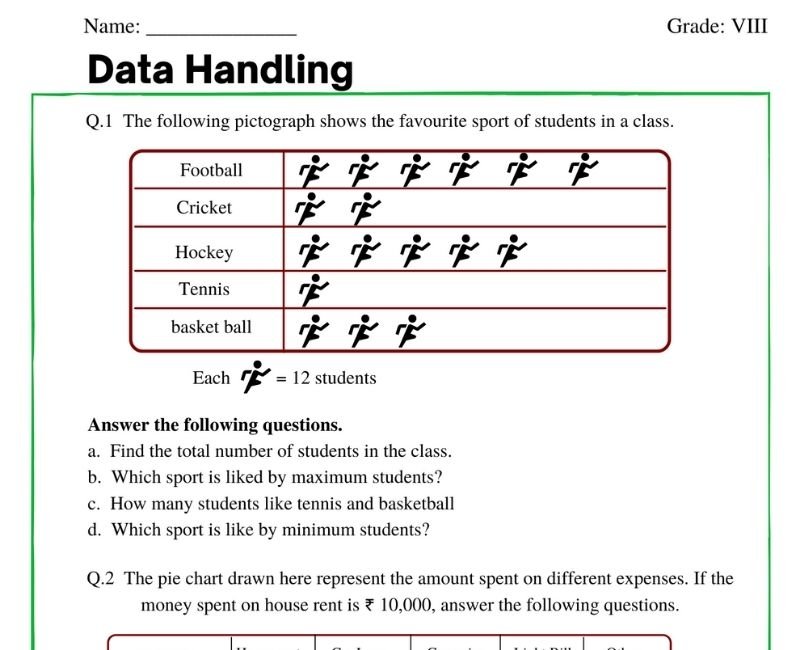
Dive into the enthralling world of numbers and patterns with the Class 8 Data Handling worksheet, a treasury of engaging exercises that invite you to unravel the mysteries of data interpretation and analysis. Picture this: you're a detective, and each piece of data is a clue to solving a puzzle. With every task you complete, you get one step closer to cracking codes and revealing secrets hidden within diverse data sets!
Imagine yourself skillfully managing and interpreting information through various ingenious challenges. Armed with the Class 8 Data Handling worksheet, you'll be nurtured to become a data whiz kid, adept at distinguishing between different types of data and practicing the prestigious art of organizing and presenting it in the most impactful way possible.
Now, imagine the pride of mastering the calculations and interpretations that seemed complex at first. With the Class 8 Data Handling worksheets with answers in PDF format, accessible at your fingertips, each correct answer you check feels like a badge of honor, a testament to your newly acquired skills and understanding.
But it doesn't end there! Are you ready to push your boundaries? The Data Handling class 8 extra questions unfurl a canvas for you to paint your knowledge on, challenging you with scenarios that stimulate your intellectual curiosity and demand your critical thinking. They tease your brain, nudging you to explore the realms of what you know and venture into the exciting unknown.
And there's a special treat in the mix—the data handling class 8 pie chart exercises. These colorful, circular charts will be your allies in visual storytelling, helping you illustrate the proportions of data elements in a whole new light. As you segment and shade them, every slice of the pie becomes a delicious morsel of information, ready for you to savor and explain in simple terms.
Each component of the Class 8 Data Handling worksheet, enriched with extra questions and solutions, is crafted to strengthen your grasp on data, sharpening your abilities just the way a mathlete hones their talents. So, grab your worksheet, and embark on this animated journey through the captivating universe of data! With every question you solve, chart you draft, and solution you find, you'll be building not just your confidence but also laying a cornerstone for your future in the discipline of mathematics. Enter the arena of data handling, where every number tells a story and every chart sings a song of insights waiting to be discovered.
Data handling in Class 8 introduces students to the organized collection, presentation, analysis, and interpretation of data. It's a step into the world of statistics allowing students to understand various data representations like bar graphs, histograms, and pie charts. This section of Class 8 Mathematics encapsulates methods to manage data systematically, ensuring students grasp concepts such as mean, median, mode, and range. It equips learners with the analytical skills necessary to draw conclusions from data, preparing them for more complex statistical studies in higher grades. Understanding data handling is crucial for real-life application in sciences, economics, and various other domains.
Worksheets are a vital educational resource in mastering data handling concepts. Class 8 data handling worksheets with answers in PDF format provide a structured path for students to practice at their own pace. These worksheets encompass a range of exercises from basic data organization to complex analysis, like interpreting data sets and solving problems related to mean, median, and mode. Having answers included enables students to self-assess their understanding and pinpoint areas needing improvement. Such resources are indispensable for reinforcing theoretical knowledge through practical application, significantly boosting students' confidence in handling data efficiently.
The pie chart section in class 8 data handling is all about presenting data in a visually appealing circular graph divided into slices that represent data proportions. Students learn how to create and interpret pie charts, a skill that enhances their ability to visually analyze and present data concisely. They explore how each slice of the pie relative to the whole provides insights into the dataset's composition. This concept not only strengthens their data presentation skills but also their fraction and percentage calculation abilities. Pie charts vividly illustrate segments of data, making them a favorite for reporting and understanding market shares, survey results, and allocation of resources in various sectors.