NCERT Class 4 Maths
Data Handling Class 4 Maths Worksheet with Quiz and Activities
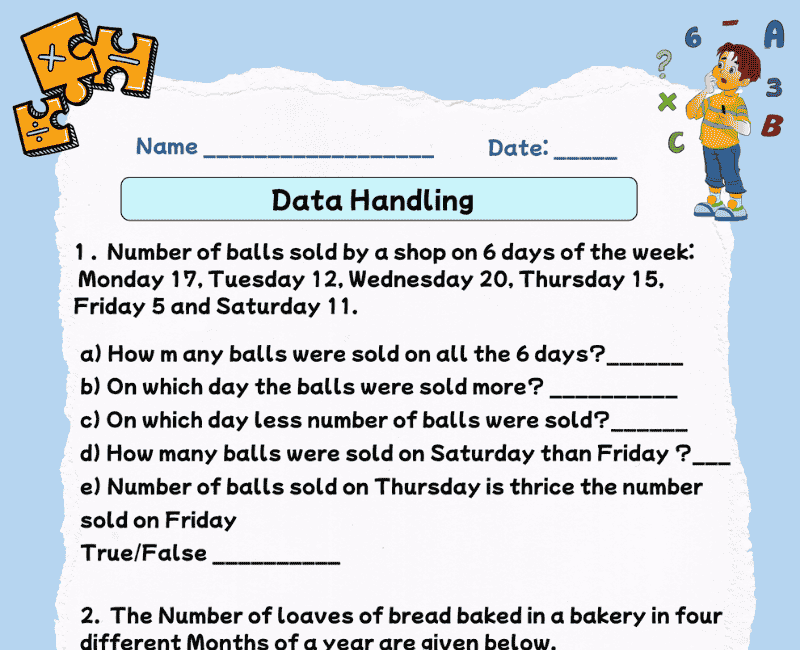
NCERT Maths Mela Chapter 14: collect data with surveys, count tally marks, make tables and read pictographs and bar graphs. On WitKnowLearn you get the Data Handling Class 4 online quiz, online activities and interactive games, maths labs and a practice sheet, all on one page.
Flip the cards and try the Shadow Lab, then tap the Games, Labs or Challenges square.
Data Handling Class 4 Online Quiz
20 questions · tap an answer to move on · full review at the end
Flip the cards, try the Tally Table Lab, then play the games, do the labs and take the challenges. Earn up to 3 stars in every activity.
Fact cards: tap a card to flip it
Tally Table Lab
Three class surveys are recorded with tally marks. Count the tallies for each answer and fill in the table. A wrong number shows a counting hint.
Challenge marks: 0 / 15 (0 of 5 challenges done)
Finish all 5 challenges to see your comment.
Practice sheet
Data Handling Class 4 Activities
Run surveys, count tallies, read pictographs and compare bars. Earn up to 3 stars in every activity.
What is data?
Data is information we collect, like the favourite colours of our classmates. We can record it with tally marks, put it in a table, and show it as a pictograph or a bar graph.
A train 🚂 station counts how many people travel each day and shows it on a bar graph!
Ways to show data
| Way | Looks like | Example |
|---|---|---|
| ✏️ tally marks | lines in 5s | 5 groups and 1 line = 26 |
| 📊 table | rows and columns | Kho-kho 6 |
| 🖼️ pictograph | pictures and a key | 1 picture = 3 |
| 📈 bar graph | bars | taller = more |
How to answer questions from data
- Read the title and the key.
- Find the most and the least.
- Add to find how many in all.
- Subtract to find how many more.
More examples
This Data Handling worksheet for Class 4 (NCERT Maths Mela Chapter 14) turns surveys and graphs into a train ride with online activities and interactive games. Flip the cards, count surveys in the Tally Table Lab, then play the games, do the maths labs and try the challenges.
Maths Data Handling Class 4
Data Handling is Chapter 14 of the new NCERT Maths Mela textbook for Class 4. Children carry out simple surveys, record answers with tally marks, put the data into tables, read pictographs using a key, look at bar graphs, and answer questions about which is the most and least, how many in all and how many more. This guide explains each idea in simple language for Class 4 students, parents and teachers. It goes with the Data Handling worksheet for Class 4 on WitKnowLearn, which also gives an online quiz, online activities and interactive games on the same page.
Introduction to NCERT Class 4 Maths Chapter 14: Data Handling
Book: NCERT Maths Mela, Class 4 (new syllabus). Chapter: 14, Data Handling. The activities on this page follow the ideas of the chapter in our own words and examples; they are not copied from the textbook.
What is there in this chapter
- Collecting data with a survey
- Recording data with tally marks
- Making and reading tables
- Reading pictographs and their keys
- Looking at bar graphs
- Answering questions from data: most, least, total and difference
Learning objectives
These objectives are written for this page from the chapter's goals; they are not copied from the book.
- Collect and record data using tally marks.
- Organise data in a table.
- Read pictographs and simple bar graphs.
- Answer questions by comparing and adding data.
Learning outcomes
After this page a child can:
- Read 5 tally groups and 1 line as 26.
- Use a key of 1 picture = 3 to read 7 pictures as 21.
- Find the most and least popular choice in a table.
- Find the difference between the tallest and shortest bars.
Data Handling Class 4 resources on this page
| Resource | What it does |
|---|---|
| Data Handling Class 4 online quiz | 20 questions in three levels with a full answer review |
| Flip cards | Six cards on surveys, tally marks, tables, pictographs, the key and bar graphs |
| Tally Table Lab | Count the tally marks from three surveys and fill in the table |
| 5 interactive games | More than 20 tallies, show 20 bubbles, tally memory, data gaps, which shows more |
| 5 maths labs | Pictograph, table, bar graph, survey stories, ways to show data |
| 5 challenges | Marked out of 3 each with a total out of 15 |
| Practice sheet | 16 questions with answer boxes and a live score |
Three ways to show the same data
| Way | How it looks | Good for |
|---|---|---|
| Tally marks | Lines in groups of 5 | Counting while collecting |
| Table | Rows and columns of numbers | Reading exact numbers |
| Pictograph | Pictures with a key | Seeing the data at a glance |
| Bar graph | Bars of different lengths | Comparing quickly |
Types of questions
- Count tally marks
- Fill in a table
- Read a pictograph with a key
- Read a bar graph
- Most and least
- Total and difference
Solved examples
Common mistakes
| Mistake | Correct |
|---|---|
| Counting a closed tally group as 4 | A closed group is 5. |
| Counting pictures without reading the key | Multiply the pictures by the key. |
| Reading the number from the wrong row | Find the row name first, then read across. |
| Forgetting half pictures | Half a picture is half the key. |
Daily life
Schools count attendance, shops count what they sell, and weather reports show rainy days on graphs. Collecting and reading data helps us make good choices, like which snack to make more of for a mela.
Tips for parents and teachers
- Run a family survey on favourite foods with tally marks.
- Turn the tallies into a table and a pictograph.
- Draw a bar graph of the days of rain in a month.
- Ask "most", "least", "in all" and "how many more" questions.
- Let the child retry the challenges to earn 3 stars.
Related NCERT Maths Mela Class 4 Worksheets
- Chapter 2: Hide and Seek Class 4
- Chapter 3: Patterns Around Us Class 4
- Chapter 4: Thousands Around Us Class 4
- Chapter 5: Sharing and Measuring Class 4
- Chapter 6: Measuring Length Class 4
- Chapter 7: The Cleanest Village Class 4
- Chapter 8: Weigh it, Pour it Class 4
- Chapter 9: Equal Groups Class 4
- Chapter 10: Elephants, Tigers and Leopards Class 4
- Chapter 11: Fun with Symmetry Class 4
- Chapter 12: Ticking Clocks and Turning Calendar Class 4
- Chapter 13: The Transport Museum Class 4
Frequently Asked Questions
 Download