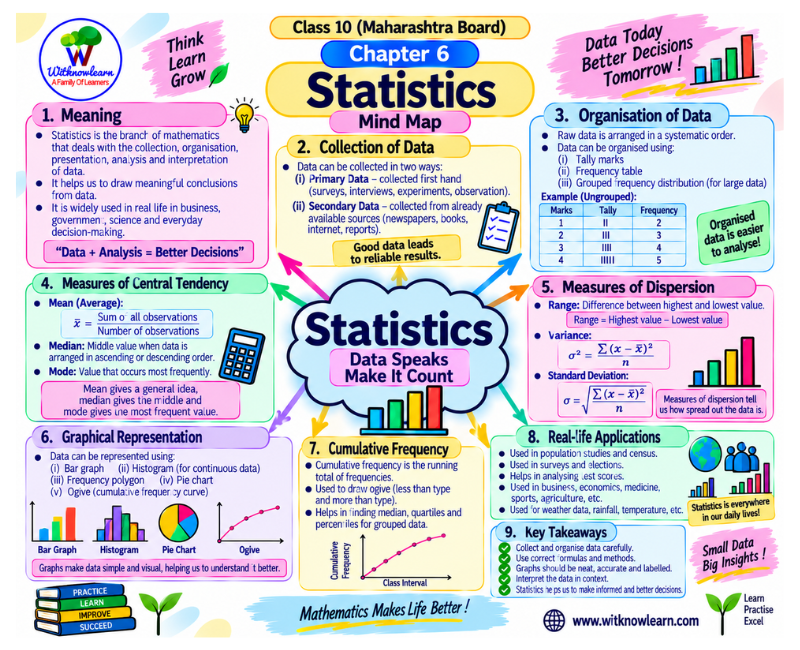
Maharashtra Board Class 10 Maths 1 Chapter 6 Statistics Mind Map
The Class 10 Maths 1 Chapter 6 Statistics Mind Map presents the important statistical concepts, formulas and graphical methods from the chapter in a clear visual format. It helps Maharashtra State Board students understand data analysis and revise the complete chapter efficiently.
This mind map covers grouped frequency distributions, cumulative frequency, mean, median, mode, graphical representation of data, histograms, frequency polygons, cumulative frequency curves and the relationship between measures of central tendency.
Topics Covered in the Statistics Mind Map
- Grouped and ungrouped data
- Frequency distribution tables
- Class intervals and class marks
- Cumulative frequency
- Mean of grouped data
- Median of grouped data
- Mode of grouped data
- Empirical relationship between mean, median and mode
- Histogram and frequency polygon
- Less-than and more-than cumulative frequency curves
- Interpretation of statistical data
Benefits of Using This Mind Map
The mind map helps students connect frequency tables with statistical formulas and graphs. It organises the steps required to calculate mean, median and mode, making long numerical problems easier to understand.
Students can use this resource to revise important formulas, identify the required columns in a table and select the correct graphical representation for the given data.
How to Use This Mind Map
Begin by identifying the type of data and the required statistical measure. Follow the relevant branch to recall the formula and table columns. For graphical questions, check the axes, scale, class intervals and plotted points before completing the graph.
Related Chapter 6 Study Resources
Practise statistical calculations and graphs using the Class 10 Maths 1 Chapter 6 Statistics Worksheet .
Check complete answers and calculation steps using the Maharashtra Board Class 10 Maths 1 Chapter 6 Solutions .
Frequently Asked Questions about the Statistics Mind Map
How does this mind map help with lengthy statistical calculations?
It shows the required formula, symbols and table columns under separate branches, helping students organise their calculations in the correct order.
How can students choose the correct branch for a statistics question?
Students should first identify whether the question asks for mean, median, mode, cumulative frequency or a graph, and then follow the matching branch.
What should students check before drawing a statistical graph?
They should check the type of graph, values required on each axis, scale, class intervals and whether cumulative or ordinary frequency must be used.
Can this mind map help students compare mean, median and mode?
Yes. Separate branches display the purpose and formula for each measure, making it easier to compare them and select the correct one for a question.
How should students revise Statistics before an examination?
Students should revise the formulas and graph branches, practise calculations from the Chapter 6 worksheet and verify their working with the detailed solutions.
 Download