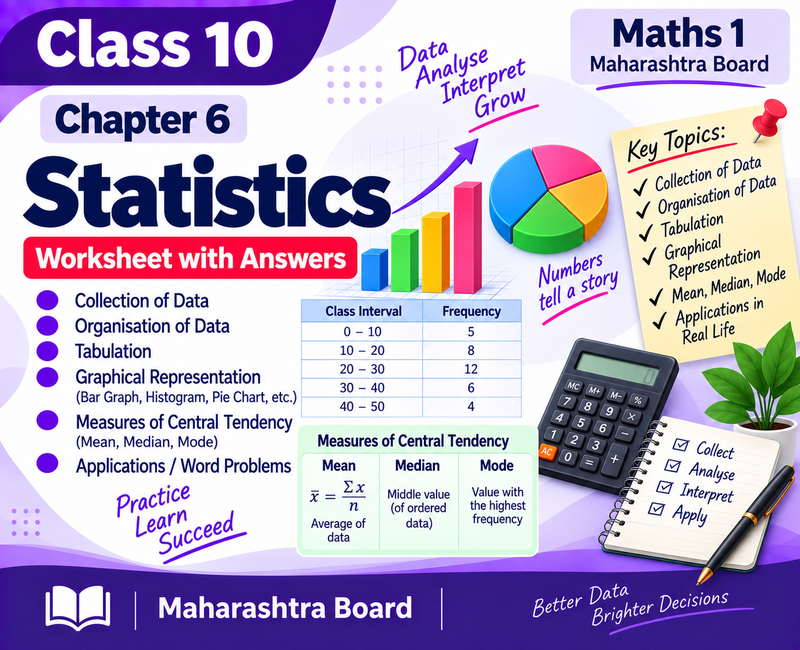
Class 10 Maths 1 Chapter 6 Statistics Worksheet
Practice Maharashtra State Board Class 10 Maths 1 Chapter 6 – Statistics with this chapter-wise worksheet with answers. The worksheet provides additional practice with statistical calculations, frequency distributions and graphical representation of data.
This Class 10 Statistics worksheet is useful for homework, classroom practice, revision, school tests, prelims and Maharashtra SSC Board exam preparation.
Chapter 6 Worksheet Contents
The worksheet provides practice with frequency distributions, grouped data, mean, median, mode, cumulative frequency and graphical representation of statistical data.
Chapter Overview
Statistics deals with the collection, organisation, representation and interpretation of numerical data. Students learn to calculate measures of central tendency and represent statistical information using suitable tables and graphs.
Topics Covered in the Worksheet
- Frequency distribution
- Grouped data
- Class intervals and class marks
- Mean
- Median
- Mode
- Cumulative frequency
- Graphical representation of data
- Interpretation of statistical data
Important Formulas
Mean:
x̄ = Σfᵢxᵢ / Σfᵢ
Median:
Median = l + [(N/2 − cf) / f] × h
Mode:
Mode = l + [(f₁ − f₀) / (2f₁ − f₀ − f₂)] × h
Common Mistakes to Avoid
- Adding frequencies incorrectly.
- Calculating class marks incorrectly.
- Selecting the wrong median class.
- Selecting the wrong modal class.
- Confusing frequency with cumulative frequency.
- Using incorrect values in statistical formulas.
- Plotting data incorrectly on graphs.
Why Practice This Chapter 6 Worksheet?
- Provides additional practice with statistical calculations.
- Strengthens understanding of mean, median and mode.
- Improves accuracy while working with frequency tables.
- Provides practice with graphs and cumulative frequency.
- Useful for prelims and Maharashtra SSC exam revision.
- Answers help students check their calculations independently.
Study Chapter 6 Before Solving the Worksheet
If you need help understanding the chapter, revise the Class 10 Maths 1 Chapter 6 Statistics Solutions on WitKnowLearn before attempting this worksheet.
Frequently Asked Questions about Statistics Worksheet
What is statistics?
Statistics is the branch of mathematics concerned with collecting, organising, representing, analysing and interpreting numerical data.
What are the main measures of central tendency?
The main measures of central tendency are mean, median and mode.
What is cumulative frequency?
Cumulative frequency is the running total of frequencies up to a particular class interval.
What is a class mark?
The class mark is the midpoint of a class interval and is found by taking the average of its lower and upper class limits.
What is the median class?
The median class is the class interval containing the median value of the distribution.
What is the modal class?
The modal class is the class interval having the highest frequency.
Does this Statistics worksheet include answers?
Yes. Answers are included so students can check their calculations after completing the worksheet.
 Download