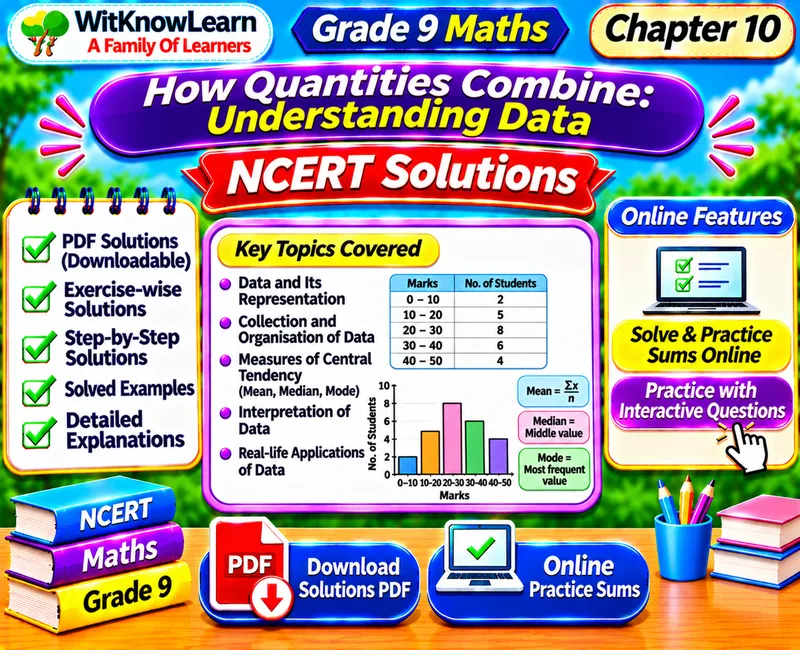
Class 9 Understanding Data Solutions and Online Practice
Step by step solutions for all 29 questions of the Ganita Manjari Chapter 10 worksheet: How Quantities Combine, Understanding Data. Try each question first, check your answer online, then reveal the solution one step at a time. Finish with the formula sheet, the explore lab and a 40 mark test.
Chapter 10 worksheet with online quiz and games →
Mistake spotter
Each solution has one wrong line. Tap it.Construction lab
Do the construction yourself with the online ruler and compassAlgebra tiles lab
Build the rectangles yourself with online tilesExplore lab
Move the sliders and watch the numbers and the picture changeOne-page formula sheet
Everything from Chapter 10 for last-minute revisionPractice test paper: 40 marks, 90 minutes
CBSE style. Section A is checked for you. Write Sections B to D on paper, then open the solutions and tick the marks you earned.Practise this chapter and more
📍 Chapter 10 worksheet: Understanding Data with online quiz and games
More NCERT Ganita Manjari Class 9 Maths worksheets:
NCERT Class 9 Math Chapter 10: Understanding Data, Solutions and Extra Sums
NCERT Class 9 math chapter 10 is How Quantities Combine: Understanding Data, the tenth chapter of the new Ganita Manjari textbook. This page gives NCERT Class 9 math chapter 10 solutions for all 29 worksheet questions, written step by step in a clean exam style. Each answer shows what each number means, adds the totals and divides by the right count.
The chapter covers combining averages of groups of different sizes, the weighted mean, mixtures and concentrations, average price of shares, run rate in cricket, mean depth of a pool, Sridharacharya's rule for mixing gold, and choosing between stacked bar, 100% stacked bar and cluster-column charts.
What makes these NCERT Class 9 math chapter 10 solutions different is that you practise online. Try each question first, type your answer and check it instantly. If you are stuck, reveal the solution one step at a time, then read where students go wrong. For two, three and four mark questions a marks checklist shows how a CBSE examiner awards marks.
The online Explore Lab lets you move sliders and see the numbers at once. You combine the averages of two sections, mix lemonade of two strengths, change the weights in a weighted score and chase a target in a T20 match, and you see why the simple average of two averages or two run rates is wrong.
Looking for NCERT Class 9 math chapter 10 extra sums? You get higher-level HOTS questions, assertion and reason questions and a chasing a target case study. You will find the amount of water to add, the weight of a missing batch of brass, the purity of mixed gold and the best chart for a table. Mistake spotters ask you to find the wrong line in a worked solution.
How to use this page: read the question, attempt it on paper, check your answer online, then open the steps and compare. Finish with the practice test. The page works on phones, tablets and computers. Take the free 90 minute test of 40 marks and get your total score out of 40.
Understanding Data Class 9 questions students ask
How do I find the combined average of two groups?
Multiply each average by the size of its group, add the results and divide by the total number of members. For 30 students at 72 and 25 students at 76 the combined average is (30 x 72 + 25 x 76) / 55, which is about 73.82.
What is a weighted mean?
A weighted mean multiplies each value by its weight, adds the results and divides by the sum of the weights. If all weights are equal it is the ordinary mean, and doubling all the weights does not change it.
How do I find the concentration of a mixture?
Find the amount of substance in each part, add them and divide by the total volume. The result lies between the lowest and highest concentrations, nearer the one with more quantity.
Why is the run rate not the average of two run rates?
Run rate is total runs divided by total overs. Two periods with different numbers of overs have different weights, so you must add the runs and the overs first.
Which chart should I use to compare totals and which for parts?
Use a stacked bar chart to compare totals and their parts. A 100% stacked bar chart compares shares but hides totals. A cluster-column chart compares one part across groups because every column starts at zero.
WitKnowLearn: worksheets, notes and solutions for NCERT and CBSE. Solutions follow the Class 9 Maths Ganita Manjari Chapter 10 worksheet.
 Download