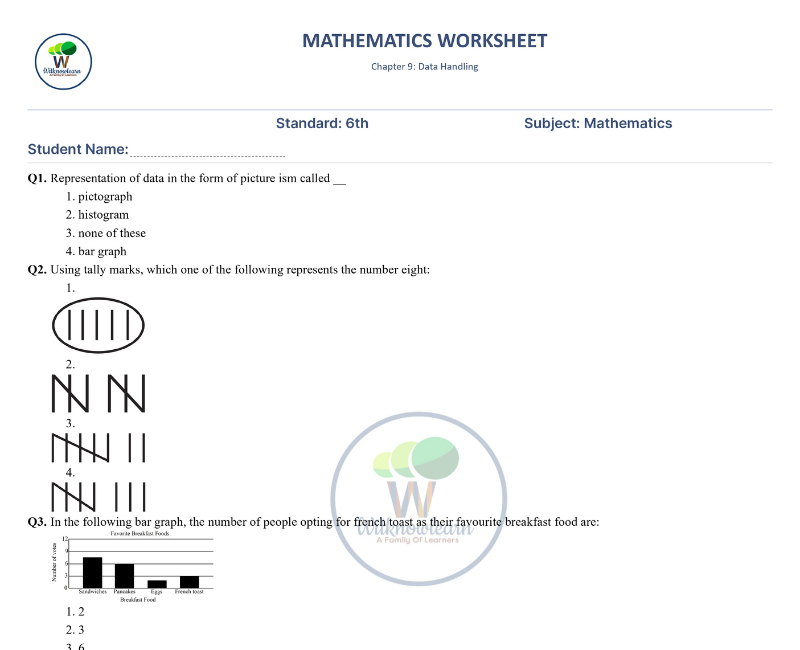
Data Handling Class 6 Maths Worksheet with Quiz and Activities
In this chapter: tally marks, pictographs, bar graphs and the mean. Build a bar graph and a pictograph yourself. On WitKnowLearn you get the Data Handling Class 6 online quiz, online activities and interactive games, a data lab, a virtual lab and a worksheet-style practice sheet for Class 6 Maths.
Data Handling Class 6 Online Quiz
Includes assertion and reason, case study and higher order thinking questions. Tap an answer and the next question comes up.
Data Handling Class 6 Activities
👆 Tap a tab to switch: Learn, Games, Labs, Challenges, Virtual Lab and Practice sheet
Data Handling: data and graphs
A short read for Class 6 before you play. These notes cover Data Handling: collecting and organising data, tally marks, pictographs, bar graphs and the mean.
📝 Collecting and organising data
Data is information such as favourite colours or marks. We organise it with tally marks, counting in fives, and write the frequency of each item in a table.
🙂 Pictographs
A pictograph shows data with symbols. A key tells what each symbol means, for example one symbol for 2 children.
📊 Bar graphs and the mean
A bar graph shows each quantity as a bar whose height is read on a scale. The mean is the sum of the data divided by how many values there are.
Data Handling Class 6 Maths Activities
Follow every step on the Number Train. Earn up to 3 stars in every activity.
This page covers Data Handling: collecting and organising data, tally marks, pictographs, bar graphs and the mean for Class 6 maths. It covers collecting data, tally marks, frequency tables, pictographs, bar graphs and the mean.
The activities are pitched at Class 6 level. Build a bar graph by dragging bar heights, build a pictograph by dragging symbols and match graphs with their features. Explore more Class 6 maths worksheets on WitKnowLearn after this chapter.
Key ideas and facts to know
| Graph | Shows data using | Key feature |
|---|---|---|
| Tally chart | strokes | groups of five |
| Pictograph | symbols | a key |
| Bar graph | bars | a scale |
How to use this page
- Flip the six cards and try the Data Lab in the Learn tab.
- Play the five games and do the hands-on labs, where you drag and move things, to see each idea at work.
- Finish the five challenges to collect up to 15 points.
- Do two virtual experiments and build a pictograph in the studio.
- Take the online quiz, with assertion and reason and case study questions, and fill in the practice sheet.
Worked examples
6 × 10 = 60 books.
(4 + 6 + 8) ÷ 3 = 6.
This Data Handling worksheet for Class 6 maths gives you online activities and interactive games that make the chapter clear. Every activity has a goal, a hint and a short fact, so students learn while they enjoy.
Complete Guide: Class 6 Maths Data Handling
This guide is for Class 6 students, parents and teachers. It covers Data Handling: collecting and organising data, tally marks, pictographs, bar graphs and the mean for Class 6 maths and shows how to use the quiz, labs and games on this page.
Introduction to Data Handling
Data helps us answer questions about the world. This chapter shows how to collect, organise and display data.
What is there in this chapter
- Collecting data
- Tally marks and tables
- Pictographs
- Bar graphs
- Interpreting graphs
- The mean
Learning objectives
- Organise data with tally marks.
- Read and draw pictographs.
- Read and draw bar graphs.
- Find the mean.
- Reason with assertions and case studies.
Learning outcomes
- I can make a tally chart.
- I can draw a bar graph.
- I can find the mean.
Data Handling Class 6 resources on this page
| Resource | What it gives |
|---|---|
| Online quiz | Assertion and reason, case study and higher order thinking questions with a full review |
| Flip cards | 6 picture cards with one-line rules |
| Data Lab | A hands-on lab with 3 rounds |
| Games | 5 interactive games |
| Labs | Interactive labs where you drag, move and watch what happens |
| Virtual Lab | 2 experiments plus a studio that builds a pictograph |
| Challenges | 5 challenges, 15 points in all |
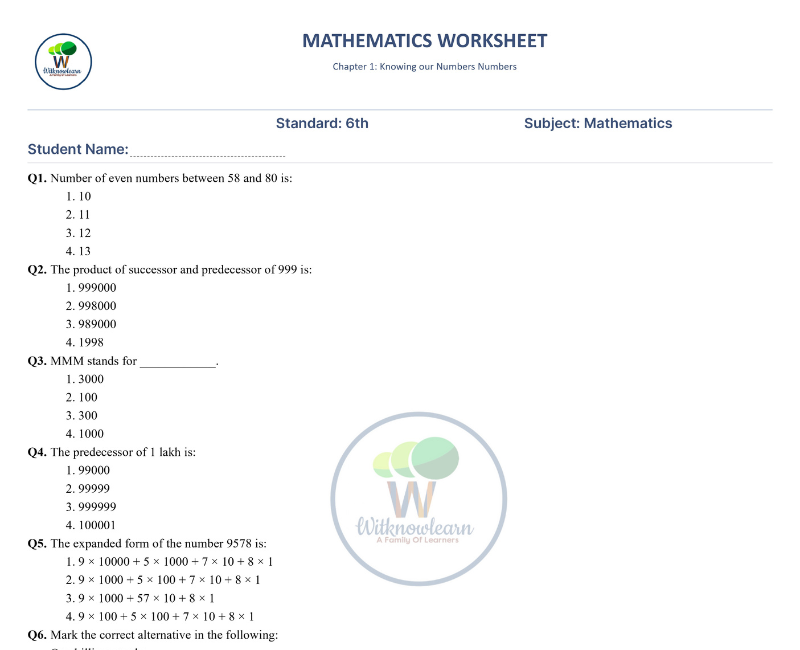
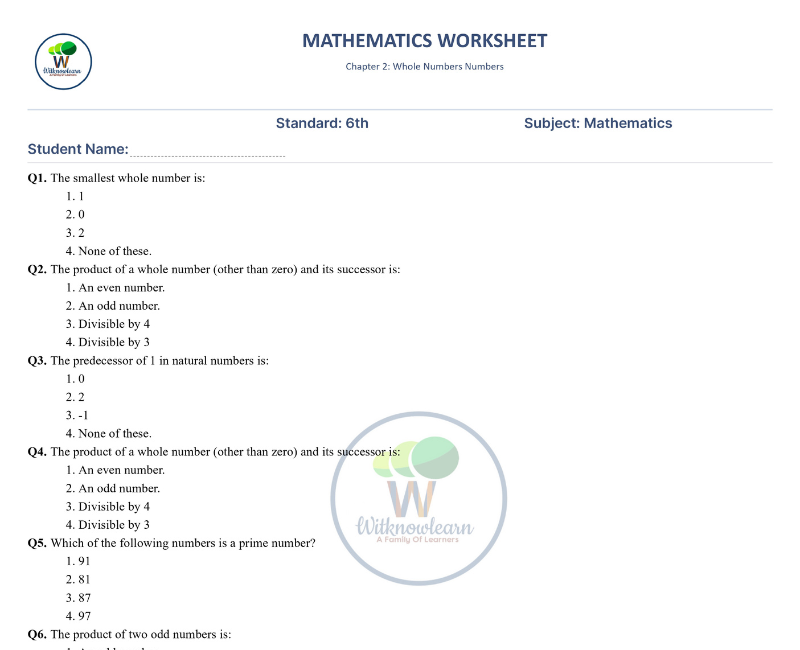
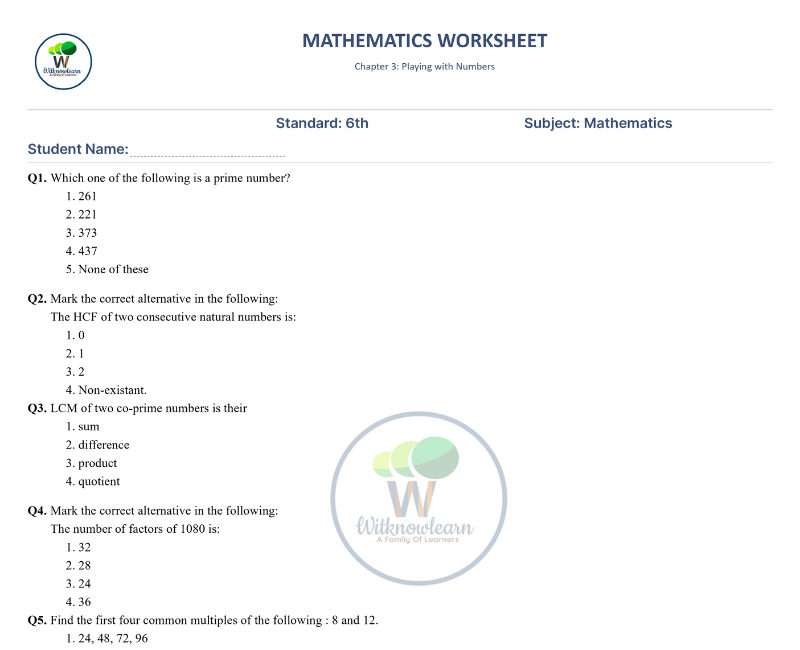
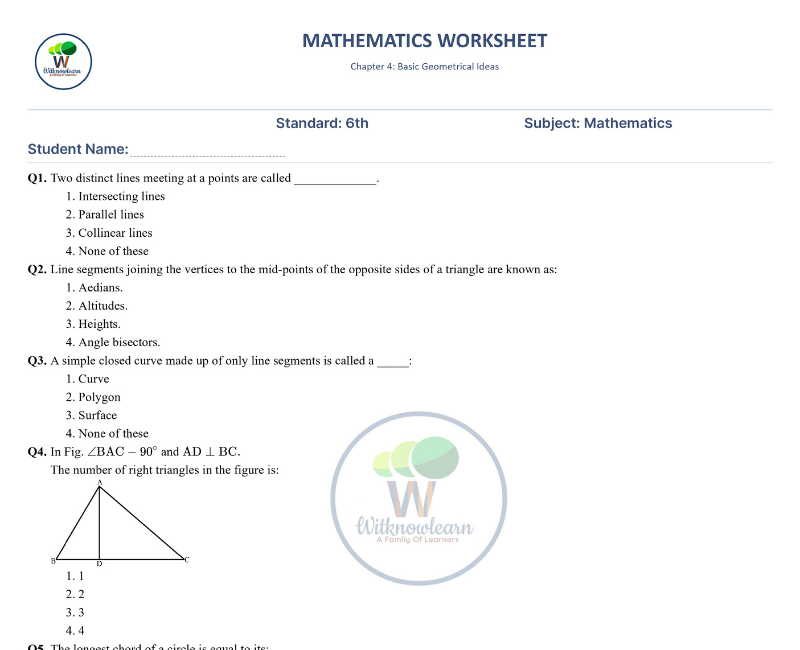
| Practice sheet | A worksheet-style sheet with 16 questions, name and date lines and a live score |
Key facts
| Idea | Rule |
|---|---|
| Tally group | 5 |
| Key | explains a symbol |
| Scale | sets the bar height |
| Mean | sum ÷ count |
Types of questions you may see
- Tally and frequency
- Pictograph questions
- Bar graph questions
- Mean and average
Solved examples
7 × 5 = 35 pens.
(5 + 7 + 9 + 7) ÷ 4 = 7.
Common mistakes
| Mistake | Correct idea |
|---|---|
| Ignoring the key of a pictograph | Read the key first |
| Drawing bars of different widths | Use equal widths |
| Dividing by the wrong count for the mean | Divide by how many values there are |
Data Handling in daily life
Data and graphs appear in school marks, cricket scores, weather charts and election results.
Tips for parents and teachers
- Ask your child to make a tally chart of cars passing by.
- Draw a bar graph of favourite fruits at home.
- Practise one assertion and one case study each week.
Data Handling Class 6 FAQs
What is data?
Data is a collection of facts such as numbers, names or measurements.
What are tally marks?
Strokes used to count. Every fifth stroke crosses the other four.
What is frequency?
The number of times an item occurs in the data.
What is a pictograph?
A graph that uses pictures or symbols to show data.
What is a bar graph?
A graph that uses bars of equal width whose heights show the quantities.
What is the scale of a graph?
The number each unit of length stands for.
How do you read a pictograph?
Read the key, count the symbols and multiply.
How do you draw a bar graph?
Choose a scale, draw equal bars and label both axes.
What is the mean?
The sum of the values divided by the number of values.
What is the average of 4, 6 and 8?
It is 6.
Which graph is best to compare quantities?
A bar graph.
What is a key in a pictograph?
It tells how many items each symbol stands for.
What topics are in Class 6 Maths Data Handling?
It covers tally marks, pictographs, bar graphs and the mean.
What can students do on this page?
Students can take an online quiz with assertion and reason and case study questions, play five games, try five online activities, finish five challenges, run the Data Lab, do two virtual experiments, build a pictograph one symbol at a time in the studio,, and fill in a 16-question practice sheet with a Show answers button.
 Download