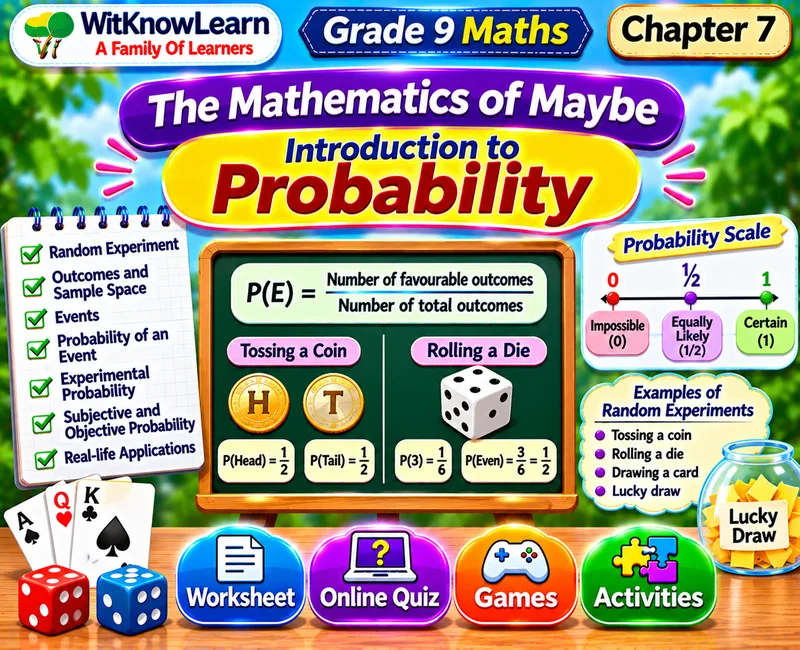
Probability Class 9 Maths Worksheet with Quiz and Activities
Toss coins, roll dice, draw tree diagrams and estimate from samples, with a two-dice sample space you build in 2D and 3D. On WitKnowLearn you get the Probability Class 9 online quiz, online activities and interactive games, a probability lab, a virtual lab and a worksheet-style practice sheet for NCERT Ganita Manjari Chapter 7.
Probability Class 9 Online Quiz
20 questions: 10 easy, 5 average and 5 thinking. Tap an answer and the next question comes up.
Probability Class 9 Activities
👆 Tap a tab to switch: Learn, Games, Labs, Challenges, Virtual Lab and Practice sheet
Probability: the Story of Maybe
A short read for Class 9 before you play. These notes follow Chapter 7 of NCERT Ganita Manjari, Part I.
🎲 Randomness
Some events cannot be predicted exactly, like a coin toss. Probability measures how likely they are.
📏 The probability scale
Probability runs from 0, for impossible events, to 1, for certain events. An even chance is 0.5.
🧪 Experimental probability
Repeat an experiment many times and count. The relative frequency settles near the true value as trials grow.
🔢 Theoretical probability
When outcomes are equally likely, probability = favourable outcomes divided by all outcomes.
🌳 Sample spaces and trees
List all outcomes with a sample space or a tree diagram, with or without replacement.
📊 Estimating from samples
A sample of 40 students can estimate the whole school of 800.
Probability Class 9 Activities
Toss, roll and count on the Number Train. Earn up to 3 stars in every activity.
This page follows NCERT Class 9 Maths Ganita Manjari, Part I, Chapter 7. Students find probabilities with coins, dice, spinners and bags, and build sample spaces.
The activities are pitched at Class 9 level. Students sort events by likelihood, pop true facts, count outcomes with tree diagrams, and solve case studies on tyres, tests and school surveys. The virtual lab builds the sample space of two dice in a flat 2D grid and as 3D bars. Explore more Class 9 maths worksheets on WitKnowLearn after this chapter.
Formulas and facts to know
| Experiment | Outcomes | Example |
|---|---|---|
| Two coins | 4 | P(two heads) = 1/4 |
| Three coins | 8 | P(exactly two heads) = 3/8 |
| Two dice | 36 | P(sum 7) = 1/6 |
| Die and coin | 12 | P(6 and heads) = 1/12 |
How to use this page
- Flip the six cards and try the Probability Lab in the Learn tab.
- Play the five games and the five labs to practise each idea.
- Finish the five challenges to collect up to 15 points.
- Build the sample space of two dice in the Virtual Lab and look at it in 2D and 3D.
- Take the 20-question online quiz, with assertion and reason and case study questions, and fill in the practice sheet.
Worked examples
6 of 36 outcomes, so P = 1/6.
5/9 × 4/8 = 5/18.
3 × 3 = 9 favourable of 64, so 9/64.
This Probability worksheet for Class 9 maths gives you online activities and interactive games that make the chapter clear. Every activity has a goal, a hint and a short fact, so students learn while they enjoy.
Complete Guide: NCERT Class 9 Maths Probability Chapter 7
This guide is for Class 9 students, parents and teachers. It covers Chapter 7 of NCERT Ganita Manjari, Part I, and shows how to use the quiz, labs and games on this page.
Introduction to Probability
The chapter introduces probability as a measurement of chance, with experiments, sample spaces, events and tree diagrams.
What is there in this chapter
- What is probability and randomness.
- The probability scale.
- Experimental probability.
- Theoretical probability.
- Analysing data with probability.
- Sample spaces and events.
- Tree diagrams.
Learning objectives
- Place events on the probability scale.
- Find experimental and theoretical probabilities.
- List sample spaces with tables and trees.
- Handle draws with and without replacement.
- Reason with assertions and case studies.
Learning outcomes
- The student can find that P(sum 7) with two dice is 1/6.
- The student can find that P(exactly two heads) with three coins is 3/8.
- The student can estimate 140 yellow sweets in a bag of 600.
- The student can solve a case study on guessing a test.
Probability Class 9 resources on this page
| Resource | What it gives |
|---|---|
| Online quiz | 20 questions: 10 easy, 5 average and 5 thinking, with assertion and reason and case study questions and a full review |
| Flip cards | 6 picture cards with one-line rules |
| Probability Lab | A hands-on lab with 3 rounds |
| Games | 5 interactive games |
| Labs | 5 activity labs |
| Virtual Lab | 2 experiments and a 2D and 3D two-dice sample space builder with aim, procedure, observations and conclusion |
| Challenges | 5 challenges, 15 points in all |
| Practice sheet | A worksheet-style sheet with 16 questions, name and date lines and a live score |
Key facts
| Idea | Rule |
|---|---|
| Probability | From 0 to 1 |
| Sample space | All outcomes, each once |
| Two dice | 36 outcomes |
| Complement | P(not E) = 1 - P(E) |
| Without replacement | Fewer balls at each step |
| Estimate | Relative frequency × total |
Types of questions you may see
- Find a probability from a sample space.
- Count outcomes with a table or tree.
- Estimate from a sample.
- Draws with and without replacement.
- Assertion and reason questions.
- Case studies on tests, bags and surveys.
Solved examples
3/4.
1/6.
140.
5/18.
3/8.
180.
Common mistakes
| Mistake | Correct idea |
|---|---|
| Treating all outcomes as equally likely. | Check, for example, that blue is more likely than red in 3 red and 7 blue. |
| Thinking tails is due after many heads. | Tosses are independent. |
| Counting outcomes twice. | List each outcome once. |
| Forgetting that the bag shrinks without replacement. | Reduce the total after each draw. |
| Giving a probability above 1. | It lies between 0 and 1. |
Probability in daily life
Weather forecasts, games, insurance and quality checks all use probability to deal with uncertainty.
Tips for parents and teachers
- Toss coins and roll dice and record the results.
- Plot relative frequencies as the trials grow.
- Draw a tree for every new problem.
- Practise one assertion and one case study each week.
Related Class 9 Maths Worksheets
- 🔢Number Systems Class 9 Worksheet
- 🧮Polynomials Class 9 Worksheet
- 📍Coordinate Geometry Class 9 Worksheet
- 📈Linear Equations in Two Variables Class 9
- 📐Introduction to Euclids Geometry Class 9
- 📏Lines and Angles Class 9 Worksheet
- 🔺Triangles Class 9 Worksheet with MCQs
- 🔷Quadrilaterals Class 9 Worksheet
- ⭕Circles Class 9 Worksheet with MCQs
- 🧩Herons Formula Class 9 Worksheet
- 📦Surface Area and Volumes Class 9 Worksheet
- 📊Statistics Class 9 Worksheet
Probability Class 9 FAQs
What is Chapter 7 of NCERT Class 9 Maths Ganita Manjari?
Chapter 7 is The Mathematics of Maybe: Introduction to Probability. It covers randomness, the probability scale, experimental and theoretical probability, sample spaces, events and tree diagrams.
What is probability?
Probability measures how likely an event is. It is a number from 0 to 1, where 0 means impossible and 1 means certain.
What is experimental probability?
It is found by repeating an experiment and counting. Experimental probability = number of times the event occurs / total number of trials. If a 4 appears 8 times in 50 rolls, it is 8/50 = 0.16.
What is theoretical probability?
Theoretical probability = number of favourable outcomes / number of equally likely outcomes. For a fair die, the probability of a number greater than 4 is 2/6 = 1/3.
What is a sample space and what is an event?
The sample space lists all possible outcomes, each once. An event is a collection of some of those outcomes. For two coins, S = {HH, HT, TH, TT}.
How many outcomes are there when two dice are rolled?
There are 6 x 6 = 36 outcomes. The sum 7 occurs in 6 of them, so its probability is 6/36 = 1/6.
What is a tree diagram?
A tree diagram lists the outcomes of an experiment step by step. Three coin tosses give 8 outcomes, and 3 of them show exactly two heads, so the probability is 3/8.
What is the difference between drawing with and without replacement?
With replacement, the bag is the same for each draw, so 4 balls give 4 x 4 = 16 ordered outcomes. Without replacement, the second draw has fewer balls, so 4 x 3 = 12.
Do earlier tosses affect the next toss of a fair coin?
No. Each toss is independent. If a fair coin shows 7 heads in 10 tosses, the next toss is still 1/2 for heads.
How do we estimate from a sample?
Find the relative frequency in the sample and multiply by the total. If 7 of 30 sweets are yellow, a bag of 600 has about (7/30) x 600 = 140 yellow sweets.
Are all outcomes of an experiment equally likely?
No. For a team match, win, lose and draw need not be equally likely. For the number of heads in three tosses, the probabilities are 1/8, 3/8, 3/8 and 1/8.
What can students do on this page?
Students can take a 20-question online quiz with assertion and reason and case study questions, play five games, try five online activities, finish five challenges, run the Probability Lab, do two virtual experiments, build the sample space of two dice in 2D and 3D, and fill in a 16-question practice sheet with a Show answers button.
 Download