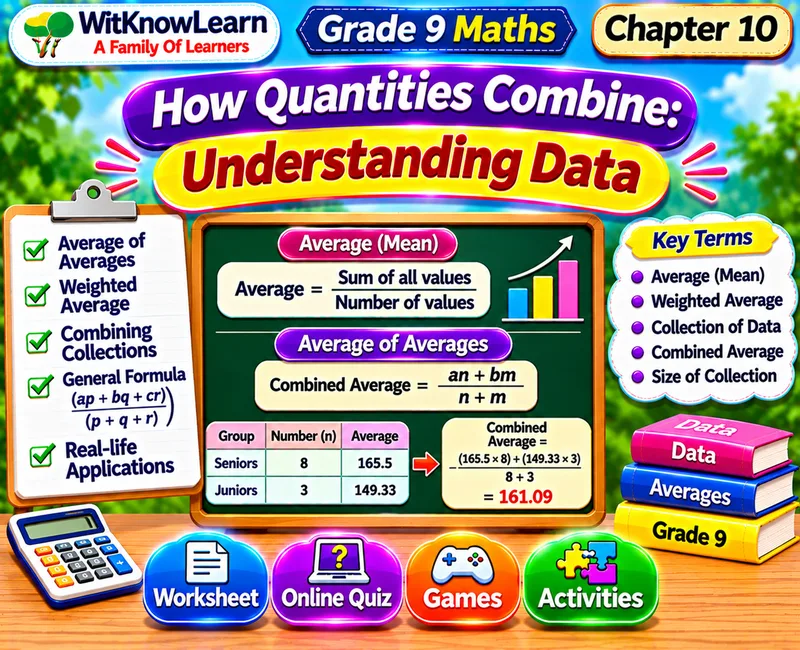
Understanding Data Class 9 Maths Worksheet with Quiz and Activities
Combine averages, mixtures and run rates, and read charts, with a triathlon stacked bar chart you build in 2D and 3D. On WitKnowLearn you get the Understanding Data Class 9 online quiz, online activities and interactive games, a data lab, a virtual lab and a worksheet-style practice sheet for NCERT Ganita Manjari Chapter 10.
Understanding Data Class 9 Online Quiz
20 questions: 10 easy, 5 average and 5 thinking. Tap an answer and the next question comes up.
Understanding Data Class 9 Activities
👆 Tap a tab to switch: Learn, Games, Labs, Challenges, Virtual Lab and Practice sheet
🧪 Data Lab
Do the experiment on screen: 3 rounds, then see what we found.
Lab progress
- 🧪 Round 1 of 3
- ⬜ Round 2 of 3
- ⬜ Round 3 of 3
- ⬜ What did we find?
🎯 Simple or Weighted?
⭐⭐⭐Goal: Sort 8 situations into simple average or weighted average.
How to play: Drag each card into its bin, or tap a card and then tap a bin.
Do the values have equal importance, or different weights?
Simple average
equal weightsWeighted average
different weightsFACTS: A weighted average counts bigger groups more.
🫧 Data Fact Bubbles
⭐⭐⭐Goal: Pop the 5 true facts. Leave the 4 false ones.
How to play: Tap a bubble to pop it. False bubbles wobble and stay.
Think about weights, totals and chart types.
FACTS: The weighted mean divides by the sum of the weights.
🧠 Data Terms Memory
⭐⭐⭐Goal: Match each term with its meaning.
How to play: Flip two cards. If they match, they stay open. Find all 6 pairs.
A term matches the phrase that explains it.
FACTS: Choose the chart that suits the question.
📝 Data Word Gaps
⭐⭐⭐Goal: Fill each gap with the right word from the tray. One word is extra.
How to play: Drag a word into a gap, or tap a word and then tap a gap.
Read the whole sentence before you choose a word.
The mean that gives each value a different importance is the mean.
Total runs divided by overs is the run .
The part of a mixture that is spice is its .
A chart with each bar split into parts is a bar chart.
In a 100% chart every bar has the same .
FACTS: Good charts make comparisons easy.
⚖ Which Is Greater?
⭐⭐⭐Goal: In each pair, tap the greater value.
How to play: Tap one card in every pair.
Work out each value first.
FACTS: Weights change the answer.
🔗 Weighted Mean Lab
⭐⭐⭐Goal: Find weighted totals.
How to play: Drag a number into each gap, or tap a number and then a gap.
Multiply each value by its weight and add.
Weighted total of 60, 64, 73 with weights 3, 2, 5 is .
The sum of the weights 3, 2 and 5 is .
The weighted total for ratings 5, 3, 4 with weights 4, 3, 2 is .
Total students in sections of 30 and 25 is .
FACTS: Weighted mean = total of (weight × value) ÷ total of weights.
➗ Mixture Lab
⭐⭐⭐Goal: Find the jaggery in a mixture.
How to play: Drag the right number into each gap.
Amount of jaggery = volume × concentration.
Jaggery in 500 mL at 10% is mL.
Jaggery in 200 mL at 20% is mL.
Total volume of the mixture is mL.
Total jaggery in the mixture is mL.
FACTS: Concentration of the mix = total jaggery ÷ total volume.
🪞 Run Rate Lab
⭐⭐⭐Goal: Work with total runs and run rates.
How to play: Drag the right number into each gap.
Runs = run rate × overs.
Runs after 19 overs at run rate 6: .
Runs after the 20th over with 12 runs: .
Runs needed in 20 overs for run rate 9: .
Run rate needed in the last 5 overs: .
FACTS: Run rates must be weighted by the number of overs.
📐 Shares Lab
⭐⭐⭐Goal: Find the average price of shares.
How to play: Drag the right number into each gap.
Average price = total cost ÷ total shares.
Cost of 25 shares at 150: rupees.
Cost of 10 shares at 30: rupees.
Total cost of the shares: rupees.
Total shares held: .
FACTS: The average price is a weighted mean of the prices.
🔬 Which Chart?
⭐⭐⭐Goal: Sort 6 questions by the best chart.
How to play: Drag each card into a bin, or tap a card and then tap a bin.
Do you need totals, or shares of the total?
Stacked bar
totals and parts100% stacked bar
shares onlyFACTS: A stacked bar shows totals. A 100% stacked bar shows shares.
❓ Data Quiz
⭐⭐⭐Goal: Answer 3 questions. Each correct answer earns 1 point.
How to play: Tap the best option.
Think about weights.
1. The weighted mean divides by
2. An equal mix of 10% and 20% solutions gives
3. The run rate is
FACTS: Weights matter.
💦 True or False Splash
⭐⭐⭐Goal: Decide if each statement is true or false.
How to play: Tap True or False.
Think about equal weights and bar lengths.
1. If all weights are equal, the weighted mean is the ordinary mean.
2. A 100% stacked chart shows total sizes.
3. A bigger group has more influence on the combined average.
FACTS: A 100% chart hides totals.
➗ Data Sums
⭐⭐⭐Goal: Solve 3 calculations. Type the number.
How to play: Type your answer and press Check.
Use weighted totals.
1. The combined average of 30 students at 70 and 20 students at 80 is?
2. The run rate after 20 overs when 180 runs are scored is?
3. 100 mL at 20% mixed with 100 mL at 10% gives what percentage?
FACTS: Totals over totals.
🔗 Match the Terms
⭐⭐⭐Goal: Match each term with its meaning.
How to play: Drag each card onto its partner, or tap a card and then tap a partner.
Think of what each term measures.
FACTS: Match terms to uses.
📖 Story Problems
⭐⭐⭐Goal: Read 3 short stories and choose the best answer.
How to play: Tap an answer.
Use totals.
1. 🏏 A team scores 70 runs in 10 overs. What is the run rate?
2. 🥤 An equal mix of 10% and 20% juice has concentration
3. 🪙 Gold: 1 g at 15000 rupees and 2 g at 30000 rupees. Average price per gram?
FACTS: Averages need weights.
📐 Combined Average Experiment
⭐⭐⭐Aim
To find the combined average of two groups of different sizes.
Objectives
- Use weighted totals.
- See which group pulls the average.
Procedure
- Take two groups.
- Find the total of the first group plus the total of the second, then divide by the number of students.
- Type the combined average.
- Choose the conclusion.
For 30 at 70 and 20 at 80: (2100 + 1600)/50 = 74.
Observation table
| Groups | Combined average |
|---|---|
| 30 at 70 and 20 at 80 | |
| 10 at 60 and 40 at 85 | |
| 25 at 60 and 75 at 100 | |
| 60 at 40 and 40 at 90 |
Conclusion
Outcomes
- I can find a combined average.
- I know the larger group pulls the average.
➗ Mixture Experiment
⭐⭐⭐Aim
To find the concentration of a mixture of two solutions.
Objectives
- Find the amount of solute in each part.
- Divide by the total volume.
Procedure
- Take two solutions.
- Find the total solute and the total volume.
- Type the concentration as a percentage.
- Choose the conclusion.
For the second: (20 + 60)/500 = 16%.
Observation table
| Mixture | Concentration (%) |
|---|---|
| 100 mL at 10% + 100 mL at 20% | |
| 200 mL at 10% + 300 mL at 20% | |
| 100 mL at 5% + 300 mL at 25% | |
| 400 mL at 5% + 100 mL at 30% |
Conclusion
Outcomes
- I can find the concentration of a mixture.
- I know equal quantities give a simple average.
🏗 Build the Triathlon Stacked Bar Chart
⭐⭐⭐Aim
To build a stacked bar chart of three athletes' swim, cycle and run times in 2D and 3D, and find who finished first.
Objectives
- Find the total time of each athlete.
- Build stacked bars from the parts.
- Choose a chart that shows the winner.
Procedure
- Type each total and the stacked bar is built.
- Use the 2D and 3D buttons to look at the same chart two ways.
- Read the finished chart.
- Answer the questions and choose the conclusion.
Add the swim, cycle and run minutes. Blue is swim, orange is cycle, green is run.
Read your figure
Outcomes
- I can build a stacked bar chart.
- I can find totals from parts.
- I can see the same chart in 2D and 3D.
Read the chapter first. Write each answer on the line. The page checks your answer as you type.
A. Weighted means
B. Mixtures
C. Run rates and shares
D. Charts
Understanding Data: the Story of Data
A short read for Class 9 before you play. These notes follow Chapter 10 of NCERT Ganita Manjari, Part I.
⚖ Combined averages
Groups of different sizes need a weighted average.
📏 Weighted mean
Multiply by weights, add, then divide by the total weight.
🥤 Mixtures
Concentration is total substance over total volume.
🏏 Run rate
Total runs over total overs, never an average of rates.
📊 Stacked bars
Show totals and their parts in one bar.
💯 100% bars
Show shares only, with every bar the same length.
Understanding Data Class 9 Activities
Combine data on the Number Train. Earn up to 3 stars in every activity.
This page follows NCERT Class 9 Maths Ganita Manjari, Part I, Chapter 10. Students combine averages, mix solutions, find run rates and read charts.
The activities are pitched at Class 9 level. Students sort simple and weighted averages, pop true facts, find mixture concentrations, and solve case studies on shares, gold, brass and cricket. The virtual lab builds a triathlon stacked bar chart in 2D and 3D. Explore more Class 9 maths worksheets on WitKnowLearn after this chapter.
Formulas and facts to know
| Situation | Total | Result |
|---|---|---|
| 30 at 72, 25 at 76 | 4060 / 55 | 73.82 |
| 500 mL 10%, 200 mL 20% | 90 / 700 | 12.9% |
| 1 g at 15000, 2 g at 30000 | 75000 / 3 | 25000 |
| 19 overs at 6, then 12 | 126 / 20 | 6.3 |
How to use this page
- Flip the six cards and try the Data Lab in the Learn tab.
- Play the five games and the five labs to practise each idea.
- Finish the five challenges to collect up to 15 points.
- Build the triathlon stacked bar chart in the Virtual Lab and look at it in 2D and 3D.
- Take the 20-question online quiz, with assertion and reason and case study questions, and fill in the practice sheet.
Worked examples
4060/55, about 73.82.
90/700, about 12.9%.
126/20 = 6.3.
This Understanding Data worksheet for Class 9 maths gives you online activities and interactive games that make the chapter clear. Every activity has a goal, a hint and a short fact, so students learn while they enjoy.
Complete Guide: NCERT Class 9 Maths Understanding Data Chapter 10
This guide is for Class 9 students, parents and teachers. It covers Chapter 10 of NCERT Ganita Manjari, Part I, and shows how to use the quiz, labs and games on this page.
Introduction to Understanding Data
The chapter shows how to combine quantities correctly using weights, and how to display data with the right chart.
What is there in this chapter
- Combining averages.
- Weighted mean.
- Mixtures and concentrations.
- Run rates.
- Changing a mean with new values.
- Stacked bar charts.
- Cluster-column and 100% stacked charts.
Learning objectives
- Combine averages with weights.
- Find the concentration of mixtures.
- Find and update run rates.
- Choose a suitable chart.
- Reason with assertions and case studies.
Learning outcomes
- The student can find a combined average of 73.82.
- The student can find that a mixture is 12.9%.
- The student can find that a team needs 55 runs in 5 overs.
- The student can build and read a stacked bar chart.
Understanding Data Class 9 resources on this page
| Resource | What it gives |
|---|---|
| Online quiz | 20 questions: 10 easy, 5 average and 5 thinking, with assertion and reason and case study questions and a full review |
| Flip cards | 6 picture cards with one-line rules |
| Data Lab | A hands-on lab with 3 rounds |
| Games | 5 interactive games |
| Labs | 5 activity labs |
| Virtual Lab | 2 experiments and a 2D and 3D stacked bar chart builder with aim, procedure, observations and conclusion |
| Challenges | 5 challenges, 15 points in all |
| Practice sheet | A worksheet-style sheet with 16 questions, name and date lines and a live score |
Key facts
| Idea | Rule |
|---|---|
| Weighted mean | Total of w x value / total weight |
| Equal weights | Simple average |
| Run rate | Runs per over |
| Stacked bar | Totals and parts |
| 100% bar | Shares only |
| Doubling weights | No change |
Types of questions you may see
- Combined averages.
- Mixtures and alloys.
- Run rates and updating means.
- Choosing a chart.
- Assertion and reason questions.
- Case studies on shares, brass and cricket.
Solved examples
73.82.
12.9%.
67.3%.
45 km.
100 kg.
55.
Common mistakes
| Mistake | Correct idea |
|---|---|
| Averaging two averages. | Weight each by its group size. |
| Averaging two run rates. | Divide total runs by total overs. |
| Using a simple average for depth. | Weight by section length. |
| Reading winners from a 100% chart. | Use a stacked bar for totals. |
| Forgetting to add the volumes. | Divide by the total volume. |
Understanding Data in daily life
Marks, cricket scores, alloys, medicines and share prices all need weighted averages.
Tips for parents and teachers
- Write the totals before dividing.
- Check that the answer lies between the smallest and largest value.
- Ask which chart answers the question.
- Practise one assertion and one case study each week.
Related Class 9 Maths Worksheets
- 🔢Number Systems Class 9 Worksheet
- 🧮Polynomials Class 9 Worksheet
- 📍Coordinate Geometry Class 9 Worksheet
- 📈Linear Equations in Two Variables Class 9
- 📐Introduction to Euclids Geometry Class 9
- 📏Lines and Angles Class 9 Worksheet
- 🔺Triangles Class 9 Worksheet with MCQs
- 🔷Quadrilaterals Class 9 Worksheet
- ⭕Circles Class 9 Worksheet with MCQs
- 🧩Herons Formula Class 9 Worksheet
- 📦Surface Area and Volumes Class 9 Worksheet
- 📊Statistics Class 9 Worksheet
Understanding Data Class 9 FAQs
What is Chapter 10 of NCERT Class 9 Maths Ganita Manjari?
Chapter 10 is How Quantities Combine: Understanding Data. It covers combined averages, weighted means, mixtures, run rates and charts such as stacked bars.
What is a weighted mean?
A weighted mean multiplies each value by its weight, adds the results and divides by the sum of the weights. For 60, 64, 73 with weights 3, 2, 5 it is 673/10 = 67.3.
Why is the average of two averages often wrong?
It ignores the sizes of the groups. 30 students at 72 and 25 at 76 give 4060/55, about 73.82, not 74.
When does the simple average of averages work?
It works only when all the groups are the same size, because then every group has the same weight.
How do we find the concentration of a mixture?
Divide the total amount of the substance by the total volume. 500 mL at 10% with 200 mL at 20% gives 90/700, about 12.9%.
What is a run rate?
The run rate is total runs divided by total overs. 70 runs in 10 overs is a run rate of 7.
Why is the final run rate not the average of the two rates?
Different numbers of overs have different weights. 125 runs in 15 overs and 55 in 5 overs give 180/20 = 9, not 9.67.
What happens if every weight is doubled?
The weighted mean stays the same, because the factor 2 cancels from the top and bottom.
What is a stacked bar chart?
A stacked bar chart splits each bar into parts. The bar length shows the total, so totals are easy to compare.
What is a 100% stacked bar chart?
Every bar has the same length of 100%, so it shows shares of each total but not which total is larger.
How do we find the average price of shares or gold?
Divide the total cost by the total quantity. 1 g at 15000 and 2 g at 30000 cost 75000 for 3 g, an average of 25000 per gram.
What can students do on this page?
Students can take a 20-question online quiz with assertion and reason and case study questions, play five games, try five online activities, finish five challenges, run the Data Lab, do two virtual experiments, build a stacked bar chart in 2D and 3D, and fill in a 16-question practice sheet with a Show answers button.
 Download