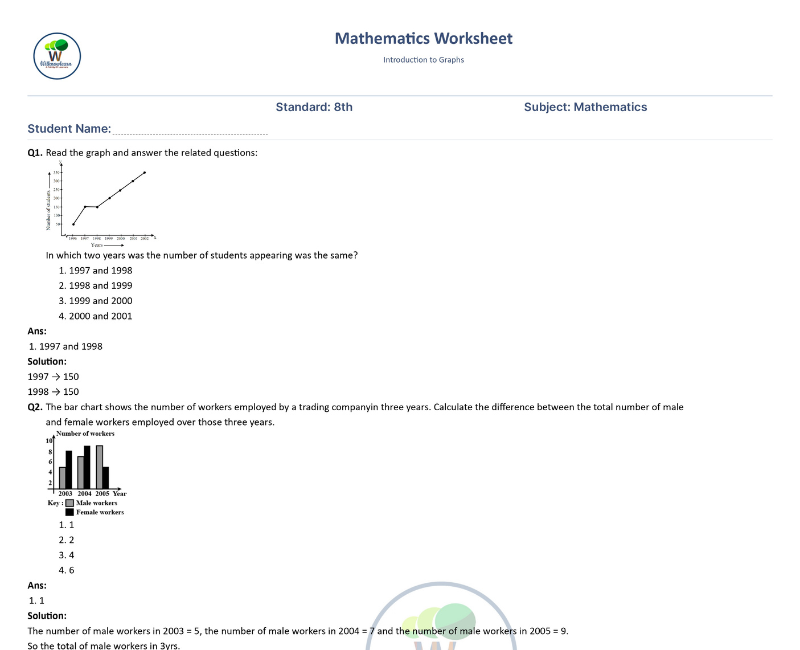
Coordinates and Line Graphs Class 8 Maths Worksheet with Quiz and Activities
Learn coordinates and graphs: plot points, name quadrants, read line graphs and plot the line y = 2x. On WitKnowLearn you get the Coordinates and Line Graphs Class 8 online quiz, online activities and interactive games, a graph lab, a virtual lab and a worksheet-style practice sheet for Class 8 Maths.
Coordinates and Line Graphs Class 8 Online Quiz
20 questions: 10 easy, 5 average and 5 thinking. Tap an answer and the next question comes up.
Coordinates and Line Graphs Class 8 Activities
👆 Tap a tab to switch: Learn, Games, Labs, Challenges, Virtual Lab and Practice sheet
Coordinates and Line Graphs: Coordinates, Line Graphs and Linear Graphs
A short read for Class 8 before you play. These notes cover Introduction to Graphs: Coordinates and Line Graphs.
📍 Coordinates and axes
Two number lines, the horizontal x-axis and the vertical y-axis, meet at the origin (0, 0). A point is written as (x, y). To plot (3, 2) go 3 units right and 2 units up.
🧭 Quadrants
The axes split the plane into four quadrants. The signs of x and y decide where a point lies, so (3, 4) is in the first quadrant and (-3, 4) is in the second.
📈 Line and linear graphs
A line graph joins points to show change over time. A linear graph such as y = 2x is a straight line through the origin, and a steeper distance-time line means a faster speed.
Coordinates and Line Graphs Class 8 Maths Activities
Follow every step on the Number Train. Earn up to 3 stars in every activity.
This page covers Introduction to Graphs: Coordinates and Line Graphs for Class 8 maths. It covers coordinates and axes, plotting points, the four quadrants, plotting, line graphs, linear graphs and distance-time graphs.
The activities are pitched at Class 8 level. Sort points by axis, name quadrants, read line graphs and plot the line y = 2x on a grid in the studio. Explore more Class 8 maths worksheets on WitKnowLearn after this chapter.
Key ideas and facts to know
| Quadrant | Sign of x | Sign of y |
|---|---|---|
| First | + | + |
| Second | - | + |
| Third | - | - |
| Fourth | + | - |
How to use this page
- Flip the six cards and try the Graph Lab in the Learn tab.
- Play the five games and the five labs to practise each idea.
- Finish the five challenges to collect up to 15 points.
- Do two virtual experiments and plot the line y = 2x on a grid in the studio.
- Take the 20-question online quiz, with assertion and reason and case study questions, and fill in the practice sheet.
Worked examples
x is negative and y is positive, so it is in the second quadrant.
120 / 3 = 40 km per hour.
This Coordinates and Line Graphs worksheet for Class 8 science gives you online activities and interactive games that make the chapter clear. Every activity has a goal, a hint and a short fact, so students learn while they enjoy.
Complete Guide: Class 8 Maths Coordinates and Line Graphs
This guide is for Class 8 students, parents and teachers. It covers Introduction to Graphs: Coordinates and Line Graphs for Class 8 maths and shows how to use the quiz, labs and games on this page.
Introduction to Coordinates and Line Graphs
Graphs turn numbers into pictures. This topic introduces the coordinate plane, plotting points, quadrants and the graphs that show change and constant rates.
What is there in this chapter
- Axes and the origin
- Plotting points
- Quadrants
- Line graphs
- Linear and distance-time graphs
Learning objectives
- Read and plot points.
- Name the quadrant of a point.
- Read a line graph.
- Plot a linear graph.
- Reason with assertions and case studies.
Learning outcomes
- I can plot and read points.
- I can name quadrants.
- I can read line and linear graphs.
Coordinates and Line Graphs Class 8 resources on this page
| Resource | What it gives |
|---|---|
| Online quiz | 20 questions: 10 easy, 5 average and 5 thinking, with assertion and reason and case study questions and a full review |
| Flip cards | 6 picture cards with one-line rules |
| Graph Lab | A hands-on lab with 3 rounds |
| Games | 5 interactive games |
| Labs | 5 activity labs |
| Virtual Lab | 2 experiments plus a studio that plots the line y = 2x on a grid |
| Challenges | 5 challenges, 15 points in all |
| Practice sheet | A worksheet-style sheet with 16 questions, name and date lines and a live score |
Key facts
| Idea | Rule |
|---|---|
| x-axis | horizontal |
| y-axis | vertical |
| Origin | (0, 0) |
| Quadrants | four, by signs |
| Linear graph | straight line |
Types of questions you may see
- Read or plot a point
- Assertion and reason on quadrants
- Case study on a distance-time graph
- Points on a straight line
Solved examples
3 × 4 = 12.
Length 4 and width 3 give area 12.
Common mistakes
| Mistake | Correct idea |
|---|---|
| Swapping x and y | x comes first |
| Mixing up the quadrants | Check the signs |
| Reading the wrong axis | x is horizontal, y is vertical |
Coordinates and Line Graphs in daily life
Graphs are used in weather charts, sports scores, maps, speed and distance, school marks and any data that changes with time.
Tips for parents and teachers
- Plot x first, then y.
- Join points only when the graph is meant to be continuous.
- Practise one assertion and one case study each week.
Related Class 8 Maths Worksheets
- 📊Class 8 Maths Worksheet: Data Handling
- 📈Class 8 Maths Worksheet: Data Handling, Mean Median Mode
- ⚖Class 8 Maths Worksheet: Linear Equations in One Variable
- 📉Class 8 Maths Worksheet: Direct and Inverse Proportions
- 🧠Class 8 Maths Notes and Mind Maps
- 📚Class 8 Maths Worksheets, page 1
- 📚Class 8 Maths Worksheets, page 2
- 📚Class 8 Maths Worksheets, page 3
Coordinates and Line Graphs Class 8 FAQs
What are coordinates?
Coordinates are an ordered pair (x, y) that gives the position of a point on a graph.
How do I plot (3, 2)?
Start at the origin, move 3 units right along the x-axis and then 2 units up.
How do I find the quadrant of a point?
Look at the signs: (+, +) is first, (-, +) second, (-, -) third and (+, -) fourth.
What does a linear graph look like?
A linear graph such as y = 2x is a straight line through the origin.
What can students do on this page?
Students can take a 20-question online quiz with assertion and reason and case study questions, play five games, try five online activities, finish five challenges, run the Graph Lab, do two virtual experiments, plot the line y = 2x on a grid in the graph and table views,, and fill in a 16-question practice sheet with a Show answers button.
 Download