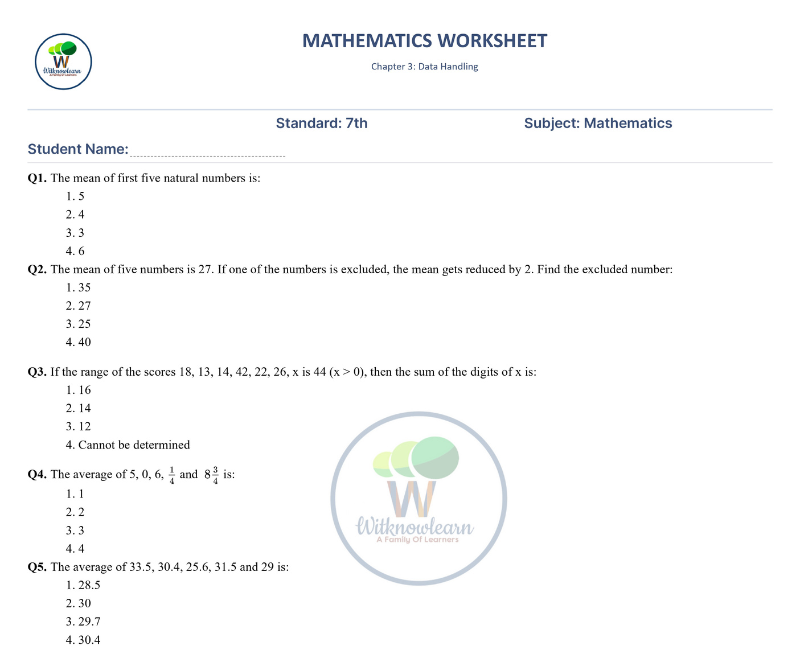
Class 7 Maths · Data Handling Worksheet
Data Handling Class 7 Worksheet with Online Quiz, Games and Activities
How can one number describe a whole class, and how likely is a six? Find out with this Data Handling worksheet for Class 7 Maths: take the Data Handling Class 7 online quiz, drag bars and level towers in hands-on activities, try three maths experiments in the Virtual Lab and play interactive games online.
Flip the cards and try the Bar Graph Lab, then tap the Games, Labs, Challenges or Virtual Lab button.
Data Handling Class 7 Online Quiz
20 questions · tap an answer to move on · full review at the end
Flip the cards, try the Bar Graph Lab, then play the games, do the labs and take the challenges. Earn up to 3 stars in every activity.
Fact cards: tap a card to flip it
Bar Graph Lab
Three graph problems to solve with your hands. Drag the blue bars up or down until the graph is right, then press Check. A wrong choice shows what goes wrong, so you can try again.
Challenge marks: 0 / 15 (0 of 5 challenges done)
Finish all 5 challenges to see your comment.
Virtual Lab: do real experiments step by step
Practice sheet
Data Handling Class 7 Activities
Drag bars to draw graphs and hit a target mean in the Bar Graph Lab, level cube towers, count a class survey with clickers, fill a probability bag and run a coin and dice simulator, then measure friends and toss coins in the Virtual Lab. Earn up to 3 stars in every activity.
What is data handling?
Data is a collection of facts, numbers or observations, such as the marks of a class, the daily temperature of a city or the favourite sport of each student. Data handling means collecting, organising, representing and interpreting this data so that it answers a question. Data collected directly by you through a survey or experiment is primary data; data taken from books, newspapers or websites is secondary data. Raw data is hard to read, so we organise it in a frequency table using tally marks, where every fifth mark crosses the other four. The number of times a value occurs is its frequency.
Steps in handling data
Every data project follows the same steps. First, decide the question, for example "Which ice-cream flavour is most popular in our class?". Next, collect the data with a survey or an experiment. Then organise it in a frequency table and represent it with a pictograph, bar graph or double bar graph. Finally, interpret it: find the mean, median, mode and range and use them to answer the question. Asking whether the data is fair and complete is part of good data handling too.
Representative values: mean, median and mode
A representative value is a single number that describes a whole data set. The three most common ones are:
- Arithmetic mean (average) = sum of all observations ÷ number of observations. For 4, 7, 3, 6 and 5 the mean is 25 ÷ 5 = 5. The mean shares the total equally, just like levelling towers of cubes, and it always lies between the lowest and the highest values.
- Median = the middle value after the data is arranged in order. For 12, 17, 19, 23, 25, 28, 31 the median is 23. With an even number of values, the median is the mean of the two middle values: for 5, 8, 9, 11, 14, 16 it is (9 + 11) ÷ 2 = 10.
- Mode = the value that occurs most often. In 2, 5, 5, 3, 5, 6 the mode is 5. A data set can have more than one mode, and the mode works even for non-numbers such as colours or flavours.
The range = highest value − lowest value shows how spread out the data is. When a data set has one extreme value, for example 4, 5, 5, 6 and 100, the median describes a typical value better than the mean.
Bar graphs and double bar graphs
A bar graph shows data with bars of equal width and equal gaps, where the height of each bar shows the value. Choosing a sensible scale, such as 1 square = 50 visitors, keeps the graph readable. A double bar graph draws two bars side by side for each category, making it easy to compare two sets of data such as the marks of boys and girls, or the temperatures of two cities.
Chance and probability
Some events are certain, some impossible and most lie in between. The probability of an event is a number from 0 to 1: probability = number of favourable outcomes ÷ total number of equally likely outcomes. Tossing a coin has two outcomes, so P(head) = 1/2. Rolling a die has six outcomes, so P(a number greater than 4) = 2/6 = 1/3. A bag with 4 red, 5 blue and 3 green marbles gives P(blue) = 5/12. In an experiment the results may not match the theory exactly, but they come closer as the number of trials grows.
This Data Handling worksheet for Class 7 Maths brings the topic to life on WitKnowLearn with an online quiz, online activities and interactive games. Students draw bars, level towers, sort tallies, paint spinners and run experiments with their own hands, then try three maths experiments in the Virtual Lab.
Data Handling Class 7 Maths Guide
Data Handling is the statistics topic of Class 7 Maths. It covers collecting and organising data, frequency tables and tally marks, the arithmetic mean, median, mode and range, bar graphs and double bar graphs, and an introduction to chance and probability. This guide explains each idea clearly for Class 7 students, parents and teachers. It goes with the Data Handling Class 7 worksheet on WitKnowLearn, which also has an online quiz, online activities, interactive games and a Virtual Lab on the same page.
What is there in this topic
- Primary and secondary data
- Frequency tables and tally marks
- Arithmetic mean and range
- Mode and median
- Bar graphs, scales and double bar graphs
- Chance and probability
Learning objectives
- Organise raw data in a frequency table.
- Calculate the mean, median, mode and range.
- Draw and read bar graphs and double bar graphs.
- Find simple probabilities from equally likely outcomes.
Learning outcomes
After this page a student can:
- Choose the best representative value for a data set.
- Find a missing value when the mean is known.
- Choose a suitable scale for a bar graph.
- Compare experimental and theoretical probability.
Data Handling Class 7 resources on this page
| Resource | What it does |
|---|---|
| Data Handling Class 7 online quiz | 20 questions in three levels with a full answer review |
| Flip cards | Six cards on organising data, fair shares, typical values, spread, chance and graphs |
| Bar Graph Lab | Drag bars to draw a graph, reach a target mean and make a target range |
| 5 interactive games | Fruit basket tally, mode hunter, median shelf, spinner painter and range pins |
| 5 hands-on labs | Mean leveller, class survey counter, probability bag, scale chooser and chance simulator |
| 5 challenges | Mean line, mode bar, probability scale, order by mean and pick the spinner, marked out of 3 each |
| Virtual Lab | Three maths experiments: heights of friends, tossing two coins and a double bar graph |
| Practice sheet | 16 questions with answer boxes and a live score |
Mean, median, mode and range at a glance
| Measure | How to find it | For 3, 5, 5, 7, 10 |
|---|---|---|
| Mean | Total ÷ number of values | 30 ÷ 5 = 6 |
| Median | Middle value after ordering | 5 |
| Mode | Most frequent value | 5 |
| Range | Highest − lowest | 10 − 3 = 7 |
Types of questions
- Frequency tables
- Mean and missing values
- Median with odd and even counts
- Mode and range
- Reading and drawing bar graphs
- Probability of simple events
- Word problems
Solved examples
Common mistakes
| Mistake | Correct |
|---|---|
| Finding the median without ordering | Arrange the values first. |
| Dividing the total by the wrong count | Count every observation, including zeros. |
| Writing the range as just the highest value | Range = highest − lowest. |
| Giving a probability greater than 1 | Probability is always from 0 to 1. |
| Unequal gaps or widths in a bar graph | Keep bar widths and gaps equal. |
Daily life
Cricket averages, class test results, weather reports, election surveys, shop sales and weather forecasts with "70% chance of rain" all use data handling.
Tips for parents and teachers
- Run a class survey and make a frequency table together.
- Use stacks of coins or blocks to show the mean as levelling.
- Toss coins or roll dice 50 times and compare with the theory.
- Read graphs from newspapers and discuss their scales.
- Let students retry the challenges to earn 3 stars.
Related Class 7 Maths Worksheets
- Integers Class 7 Worksheet
- Fractions and Decimals Class 7 Worksheet
- Simple Equations Class 7 Worksheet
- Lines and Angles Class 7 Worksheet
- Triangle and Its Properties Class 7 Worksheet
- Comparing Quantities Class 7 Worksheet
- Rational Numbers Class 7 Worksheet
- Perimeter and Area Class 7 Worksheet
- Algebraic Expressions Class 7 Worksheet
- Exponents and Powers Class 7 Worksheet
- Symmetry Class 7 Worksheet
- Visualising Solid Shapes Class 7 Worksheet
Frequently Asked Questions
 Download