NCERT JOYFUL MATHEMATICS • CLASS 2 • CHAPTER 11
NCERT Class 2 Data Handling Worksheet
Little Surveys Big Discoveries
Sort favourite-colour votes, build picture charts and uncover the stories in a table. Tap, count, compare and explain with large, clear visuals.
One Face One Child
Read the key and count each picture once.
Organise the Counts
Connect survey responses, tables and charts.
Compare and Explain
Find differences, equal counts and ties.
NCERT Class 2 Data Handling Online Quiz
20 questions • 10 easy • 5 average • 5 thinking
The timer starts with your first answer or quiz navigation. Read Question does not start it. You can revisit answers before submitting.
Question 1 of 20 • Easy
What does the key “☺ = 1 child” mean?
Five Interactive Data Handling Games
Choose a raised selector. Sort responses, build charts, compare rows and record counts in the same activity frame.
Sort the Survey Votes • Task 1 of 5
Sort every pretend survey response into its matching category. Each response represents one child.
Response 1 of 9
0 of 5 tasks completed
Five More Survey and Pictograph Activities
Update a chart, order categories, find a missing count, search response cards and test chart statements.
Update the Class Chart • Task 1 of 5
2 more children choose Red. Update the chart without changing the other counts.
Key ☺ = 1 child
New responses recorded 0 of 2
0 of 5 tasks completed
Chapter 11 Questions and Thinking Practice
Picnic and Classroom Problems • Task 1 of 5
How many children chose Apple or Guava altogether?
Key ☺ = 1 child
0 of 5 tasks completed
How to use this data studio
Ten interactive games and activities contain 50 tasks. Five thinking sets provide 25 more tasks. A separate quiz has 20 questions. Optional Read and Stop buttons stay above the question frame.
Use Previous and Next to move between tasks. Reset Task clears one task and Reset Set clears the five tasks in a set. Undo controls reverse a recorded vote, pairing or selection. Progress stays while this page remains open.
All survey records are fictional practice data. Each response represents one child, and each child gives one response in a stated one-choice survey. In the picture charts, ☺ = 1 child. A zero-count row keeps its label but has no faces. Select all tied categories when asked for every most or least category.
The large pictures may wrap onto another line on a small screen. Count every face in the row; wrapping does not create a new category. Questions, charts, answer boxes and feedback stay in the same frame.
Read about the NCERT Class 2 Data Handling worksheet
NCERT Joyful Mathematics Class 2 Chapter 11 Data Handling
This NCERT Class 2 Data Handling worksheet helps children collect responses, organise counts in tables and read pictographs. Original practice surveys use colours, picnic fruits, travel to school, games and vegetables to connect the chapter with familiar choices.
What is data handling for Class 2
Data is information collected for a purpose. If a class wants to find its favourite fruit, each child can choose one option. Record the choices, count each category and use the results to answer questions. A clear survey question helps everyone understand what is being counted.
Sorting and counting survey responses
Place each response in the correct category and count it once. A child choosing Apple belongs in the Apple collection. The vote-sorting game presents one fictional response at a time, while the response-card activity asks children to find every matching card in a collection.
Data handling tables for Class 2
A simple table pairs each category with its count. If four children choose Red, three choose Blue and two choose Green, record 4, 3 and 2 beside those labels. The total is 4 + 3 + 2 = 9 children. Keep category labels beside their own counts.
Pictograph worksheets with a clear key
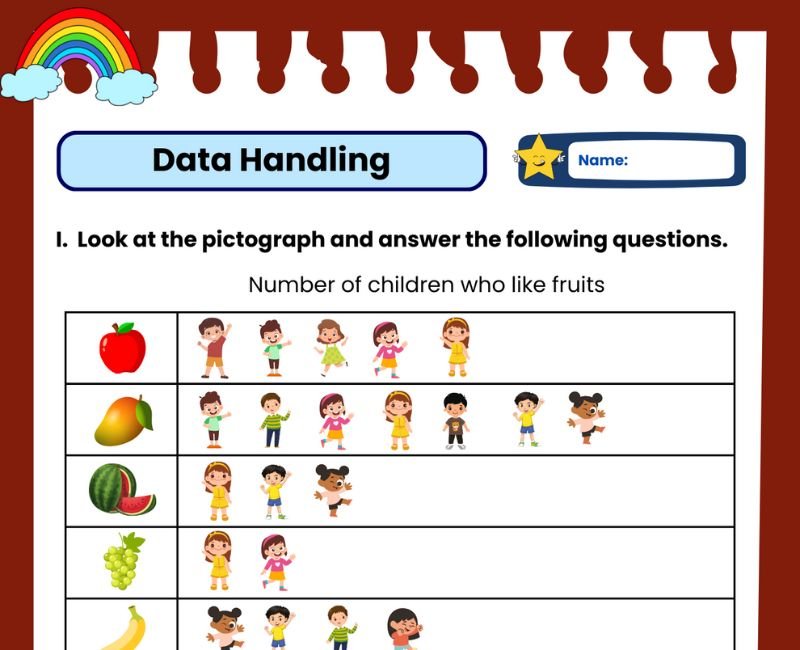
A pictograph uses pictures to represent counts. Read the key first. In this studio, one smiling face represents one child. A row with five faces therefore represents five children. The pictures are large and the category labels are ordinary readable text.
Most least and equal counts
The greatest count tells which category has the most responses. The smallest count tells which has the least. Two or more categories can tie. If Red and Blue both have five responses while Green has two, Red and Blue are tied for most.
How many more and how many fewer
Compare two counts by subtraction. If six children choose Bus and three choose Walk, three more choose Bus. Pairing one face from each row makes the difference visible: the unpaired faces show how many more are in the larger group.
Zero counts and missing information
Zero means no responses were recorded for that category. Keep its label visible and draw no faces. To find a missing count, subtract the known counts from the stated total. A blank means information has not been filled in; it should not automatically be treated as zero.
Updating a chart after new responses
When two new children choose a category, add two faces to that category. The other category counts stay unchanged and the overall total rises by two. If an existing child changes from one category to another, the category counts change but the total number of responses stays the same.
Data interpretation questions with explanations
Read whether a question asks for one category, a combined count, the total or a difference. The thinking tasks include matching chart facts, correcting a robot and checking whether statements agree with the recorded data. A class survey directly describes the children who were asked.
Checking the survey total
In a one-choice survey, add the category counts and compare the sum with the number of children asked. An unexpected total suggests checking the original records for a missing response, repeated response or counting error. Avoid changing a count without checking the evidence.
A simple classroom survey activity
Ask each participating child to choose one favourite game from a short list. Record one response per child. Make a table, draw one face per response and compare the results. Ask children to explain any ties and check that the chart total matches the number of responses.
More Class 2 Maths Worksheets
Frequently Asked Questions
What does NCERT Class 2 Data Handling teach?
Joyful Mathematics Chapter 11 develops collecting responses, organising tables, making picture charts and comparing counts through familiar survey situations.
What is a pictograph?
A pictograph shows information using pictures. Its key explains what each picture represents. Here one smiling face represents one child.
How do children find the most and least liked options?
Compare the category counts. The greatest count is most and the smallest count is least. Report every tied category when the question asks for all.
Can two categories both have the most votes?
Yes. If two categories share the greatest count, they are tied for most.
How do you find how many more?
Subtract the smaller count from the larger count. Seven responses compared with four gives three more.
How is zero shown in a picture chart?
Keep the category label and draw no faces in that row. Zero responses and a missing entry are different ideas.
How do you check the total number of responses?
Add all category counts. When each child gives one response, the total should equal the number of children who responded.
What happens when a new response is added?
The chosen category increases by one, and the overall total increases by one. Other categories stay unchanged.
What happens when someone changes their existing choice?
Subtract one from the old category and add one to the new category. The overall total stays the same.
How can a missing category count be found?
Subtract the known counts from the given total. For a total of 10 with known counts of 4 and 3, the missing count is 3.
Are these the exact answers to the textbook pictures?
The studio uses original fictional surveys aligned with the chapter topics. Use the textbook for its exact pictures and exercise counts.
What online practice is included?
There are 10 interactive games and activities with 50 tasks, 25 additional thinking tasks and a 20-question quiz. Optional audio controls read the question and hint.
 Download