Data Handling Worksheet for Class 3
Collect the clues. Build a clear chart. Explain what the numbers really show.
Explore WitKnowLearn’s data handling worksheet for Class 3 with online quiz and online activities. Practise collecting data, tally marks, frequency tables, pictographs and simple bar graphs. Read chart keys, compare most and least, find totals and differences, recognise ties and explain your conclusions with numbers.
0 of 20 answered
1. Which is an example of data?
You can return to any question and change your answer.
Sort the Survey Responses
Learning goal: Record every response once in the correct category.
- Read the response card. This is a pretend one-choice survey.
- Tap its matching colour. Sort all nine responses.
Response 1 of 9: Blue
| Category | Count |
|---|---|
| Red | 0 |
| Blue | 0 |
| Green | 0 |
Your turn to investigate.
Four Data Discoveries
Learning goal: Understand useful facts about data in daily life.
- Open all four discovery cards.
- Give your own example of each fact aloud or on paper.
Weather records
Weather observers record conditions over time. A six-day weather record describes those six days; it does not guarantee tomorrow’s weather.
One response or many
A favourite-fruit question can ask for one choice. A different survey may allow several choices. Read the survey rule before comparing the total to the number of people.
Zero is information
A recorded zero means none were counted in that category. A blank may mean the count is still unknown.
The key changes the count
Three pictures with a key of two represent six items. The same three pictures with a key of one represent three items.
Your turn to investigate.
Data Handling for Class 3 Meaning Types and Examples
What is data handling?
Data handling means collecting, organising, representing and interpreting information. Data can be counts, measurements or recorded responses. For example, the number of children choosing each fruit is data. A clear table or chart helps us compare the choices and answer questions accurately.
This Class 3 Maths worksheet focuses on simple surveys, tally charts, pictograph questions and bar graph interpretation. The same skills help us understand a library record, a toy collection or a short weather record. These are general topic exercises rather than a claim that every example belongs to one NCERT chapter.
Collect and organise
Choose a clear question, such as “Which one of these three fruits do you prefer?” Record each response once. Put matching responses together and count each category. The number of times a category occurs is its frequency.
If every child gives exactly one choice, the category counts should add to the number of children who responded. A survey allowing several choices has a different counting rule.
Represent and interpret
A representation displays the data. A table uses rows and columns, a pictograph uses pictures, and a bar graph uses bars with a number scale. Interpreting means explaining what those records show.
Always read the title, category labels and key or scale. Compare the actual counts, then check whether your conclusion is supported by the group surveyed.
Ways to show data
| Display | What it uses | What to check |
|---|---|---|
| Frequency table | Category labels and numerical counts | Match each label to its count |
| Tally chart | Marks collected in groups of five | The fifth mark crosses the first four |
| Pictograph | Repeated pictures or symbols | The key explains the value of one picture |
| Bar graph | Bars and an evenly spaced number scale | Read the scale and compare bar endpoints |
Worked example: organise a survey
Ten children each choose one game. The responses give Tag = 5, Skipping = 3 and Hopscotch = 2.
| Game | Number of children |
|---|---|
| Tag | 5 |
| Skipping | 3 |
| Hopscotch | 2 |
Total: 5 + 3 + 2 = 10 children.
Most: Tag, because 5 is the greatest count.
Least: Hopscotch, because 2 is the smallest count.
How many more chose Tag than Skipping? 5 − 3 = 2 more children.
How to read a pictograph key
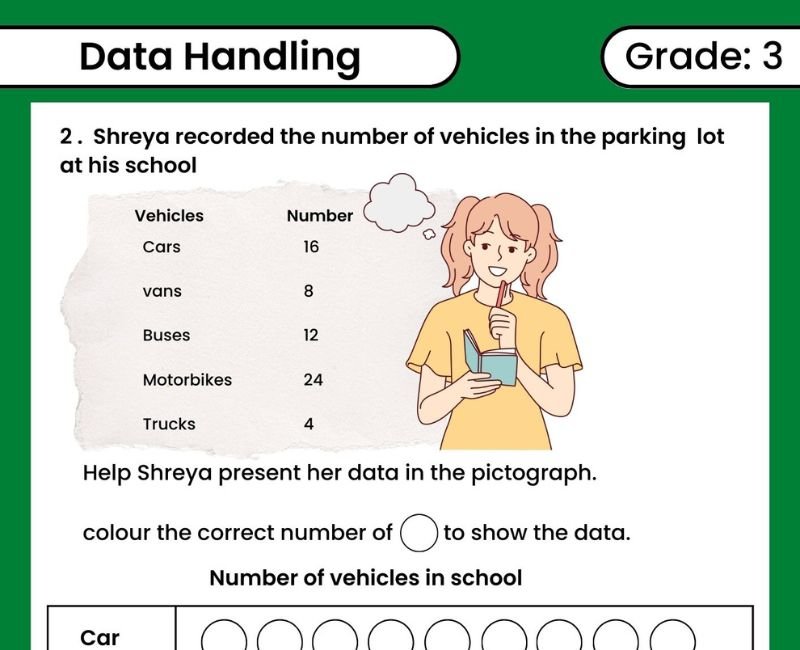
If one picture represents one child, four pictures mean four children. If one picture represents two children, four pictures mean 4 × 2 = 8 children. To build a row for eight children using that second key, draw 8 ÷ 2 = 4 pictures. Counting pictures without reading the key can give the wrong answer.
How to read a simple bar graph
Read the title to find what was counted. Find the category and look at where its bar ends on the number scale. With a scale marked 0, 2, 4, 6, 8 and 10, three intervals from zero represent six, not three. All bars should use the same evenly spaced scale and start from a common zero baseline in these beginner graphs.
More less equal and missing counts
Use addition for a combined total. Use subtraction for “how many more” or “how many fewer”. Equal highest counts give a tie for most; equal lowest counts give a tie for least. Name every tied category when asked for all of them.
If there are 14 responses altogether and the known counts are 5 and 6, their sum is 11. The missing count is 14 − 11 = 3. Check by adding back: 5 + 6 + 3 = 14. A recorded zero means none were counted. A blank entry may mean the count is unknown.
Common mistakes and corrections
| Mistake | Correction |
|---|---|
| Counting each picture as one automatically | Read the key and multiply by the picture value |
| Adding to find “how many more” | Subtract the smaller count from the larger count |
| Counting one response twice | Mark or sort every source response once |
| Naming only one category in a tie | Include every category sharing the requested greatest or smallest count |
| Assuming a blank means zero | Check whether zero was recorded or the count is missing |
| Claiming a class survey describes everyone | Limit the finding to the people who were surveyed |
Practice questions with explanations
A key shows one picture = 2 books. What do five pictures represent?
5 × 2 = 10 books. Multiply the number of pictures by the key value.
A table shows 9 red beads and 6 blue beads. How many more red beads are there?
9 − 6 = 3 more red beads. This is a difference question.
Four children choose cats and four choose dogs. Can both be most popular?
Yes, if no other category has a greater count. Equal highest counts give a tie.
One child changes an existing choice. Does the survey total increase?
No. Remove one from the old category and add one to the new category. The same child is still represented once. A new respondent would increase the total.
The online quiz gives one mark per correct answer and reports a score out of 20. Activities use different examples so that learners practise building and explaining data as well as recognising an answer.
Frequently Asked Questions
What is data handling for Class 3?
It is collecting, organising, displaying and interpreting simple information. Children count responses, make tables or charts and answer questions about the results.
What is a pictograph?
A pictograph uses pictures or symbols to represent data. Its key explains how many items each picture represents.
How do you read a pictograph with a key of two?
Count the pictures and multiply by two. Three pictures represent six items when each picture stands for two.
What are tally marks?
Tally marks record counts. Make four upright marks, then draw the fifth mark across them to form a group of five. Seven is one group of five and two extra marks.
What is a frequency table?
A frequency table lists categories and the number of times each occurs. If five children choose a game, its frequency in that survey is five.
How do you read a bar graph?
Read the title, category labels and number scale. Find where each bar ends on the scale. Equal spaces on that scale must represent equal increases in count.
How do you find the total in a chart?
Add the counts of the categories being asked about. For a pictograph, first convert pictures into actual counts using the key.
How do you solve how many more or how many fewer questions?
Subtract the smaller count from the larger count. Nine votes compared with six votes gives a difference of three.
Can two categories both have the most votes?
Yes. Categories with equal highest counts are tied for most. Include all tied categories when the question asks for every winner.
Is a blank entry the same as zero?
No. A recorded zero means none were counted. A blank may mean the count has not been recorded or is unknown.
How do you find a missing count?
Add the known counts and subtract that sum from the stated total. Then add all the completed counts to check the result.
Does one class survey tell us what every child prefers?
No. It tells us about the responses of the children surveyed under that question’s rules. It does not prove what every child in a school or elsewhere prefers.
Content references
Original examples and practice data. Surveys in the quiz and games are fictional.
 Download