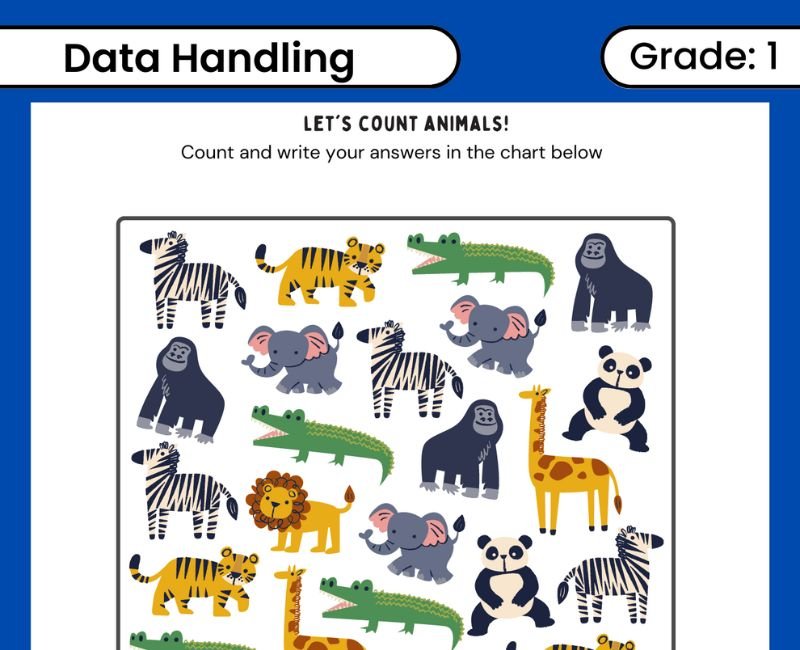
Data Handling Worksheet for Class 1
Help children organise and understand simple information with this data handling worksheet for Class 1. Begin with familiar objects, sort them into clear groups, count each group and use the results to answer questions.
This general Grade 1 maths topic connects counting with recording and comparing information. The original activities and practice questions with answers below provide additional examples for classroom discussion and home revision alongside the worksheet available on this page.
What Is Data Handling?
Data means information. For a young child, it might be the number of red, green and yellow crayons in a pencil box. Data handling involves collecting that information, organising it and using it to answer questions.
Ask children to describe what they are counting before they begin. A record of crayon colours tells us about colours in that collection; it does not tell us which colour every child prefers.
Keep activities small and concrete. Children should be able to explain where a recorded number came from by pointing to the objects or responses it represents.
Sort First, Then Count
Choose one clear sorting rule, such as colour, shape or object type. When sorting crayons by colour, put all red crayons together and make separate groups for the other colours.
Use categories that do not overlap when each object should be counted once. Check that every object has a place and that none has been counted in two groups.
Count each group carefully. Move counted objects aside or arrange them in a row. Write the total beside the category name and recount to check the record.
Read a Simple Data Table
The following original example records a collection of crayons. Use it for the practice questions below.
| Crayon Colour | Number |
|---|---|
| Red | 5 |
| Green | 3 |
| Yellow | 5 |
Read each row together: there are five red crayons, three green crayons and five yellow crayons. The category label tells us what the number describes.
Compare More, Fewer and Equal Counts
There are more red crayons than green crayons because five is greater than three. There are fewer green crayons than yellow crayons. Red and yellow crayons are equal in number.
Two categories can share the greatest count. In this example, red and yellow both have the most crayons. Green has the fewest.
To find how many more red crayons there are, match each green crayon with a red one. Two red crayons remain unmatched, showing a difference of two.
Introduce One-to-One Picture Charts
A pictograph uses pictures or symbols to represent information. Start with a key saying that each picture represents one object. Five pictures then represent five objects.
For an emoji-free activity, draw identical small squares on paper to represent crayons. Write a key: one square represents one crayon. Draw five squares for red, three for green and five for yellow.
Always read the key before counting. In other charts, a symbol might represent more than one object. For this beginner activity, keep the key at one object per symbol.
Original Data Handling Practice with Answers
Use the example table: red 5, green 3 and yellow 5.
- How many red crayons are there?
- How many green crayons are there?
- Which two colours have equal counts?
- Which colour has the fewest crayons?
- Which colours share the greatest count?
- How many more red crayons are there than green crayons?
- How many red and green crayons are there altogether?
- How many crayons are there in total?
- If one green crayon is added, what is the new green count?
- In a chart where one square represents one crayon, how many squares represent three crayons?
Show Practice Answers
1. 5
2. 3
3. Red and yellow
4. Green
5. Red and yellow
6. 2
7. 8
8. 13
9. 4
10. 3 squares
Collect Data with a Small Survey
Ask each child to choose one favourite fruit from three named options. Record one response per child with a mark, then count the marks for each option.
Check that the total responses match the number of children who participated. Explain that this survey records preferences, not the number of fruits available.
Results will vary. Accept the actual recorded counts rather than expecting a fixed answer. Ask children to compare categories and explain their conclusions using the data.
How to Use This Grade 1 Worksheet
Use the worksheet download option on this page for written practice. Read instructions aloud when needed and identify what each group or chart represents before counting.
Check the method as well as the answer. If a count is incorrect, organise the objects and count again. Ask children to point to the category or row that supports their response.
The answers above apply to the original on-page example. Answers to the downloadable worksheet depend on its actual pictures, data and questions.
Related General Class 1 Maths Worksheets
Comparing Numbers WorksheetsPractise greater, smaller and equal numbers. Numbers 1 to 9 Worksheet
Build counting confidence with small quantities. Tens and Ones Worksheet
Explore how two-digit numbers are built. Browse All Class 1 Maths Worksheets
Find general topic resources and separately labelled textbook worksheets.
Data Handling Class 1 FAQs
What is data handling for Class 1?
It means collecting, organising and comparing simple information, such as counts of objects in different groups.
Why should children sort before counting?
Sorting makes the categories clear and helps prevent objects from being missed or counted twice.
What is a pictograph?
A pictograph represents data using pictures or symbols. Its key explains what each symbol represents.
Can two groups both have the most objects?
Yes. Groups with equal greatest counts share the most.
How do children find how many more?
Match objects one-to-one or subtract the smaller count from the larger count.
Do surveys have one fixed answer?
No. Results depend on the question and the people responding. Use the information actually collected.
How can I teach data handling at home?
Sort crayons or blocks, count the groups and record the totals. Ask which group has more, fewer or equal numbers.
Are practice answers provided?
Yes. Expand Show Practice Answers to check the ten original questions based on the example table.
 Download